The search for Fallen Premiums never really stops. Well, not before your team is complete anyway. Being able to sneak a couple of FP's into your team before round 1 can potentially get you off to a flyer against the rest of the field. But how do we tell if if the fall is temporary, or permanent? To answer that, you need to analyse why they fell, and then work out if that reason has been rectified.
There can be many reasons a Premium falls. Loss of form. Deterioration of fitness, or ability to bounce back from hard games. Changes in role within the team. General wear and tear from years of football etc etc. Each individual SC Coach needs to decide what caused the fall, and if the player can bounce back.
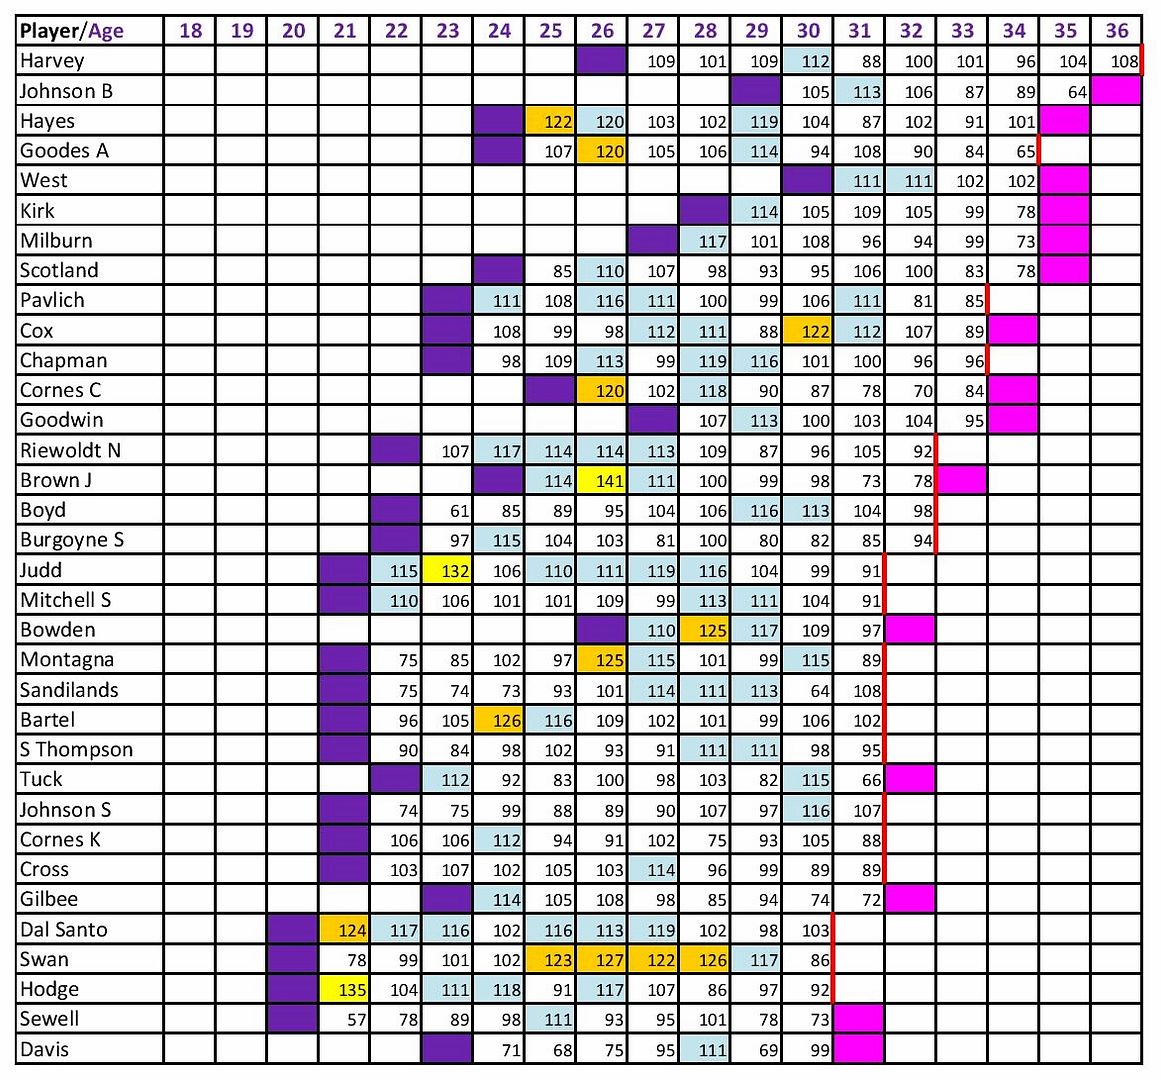
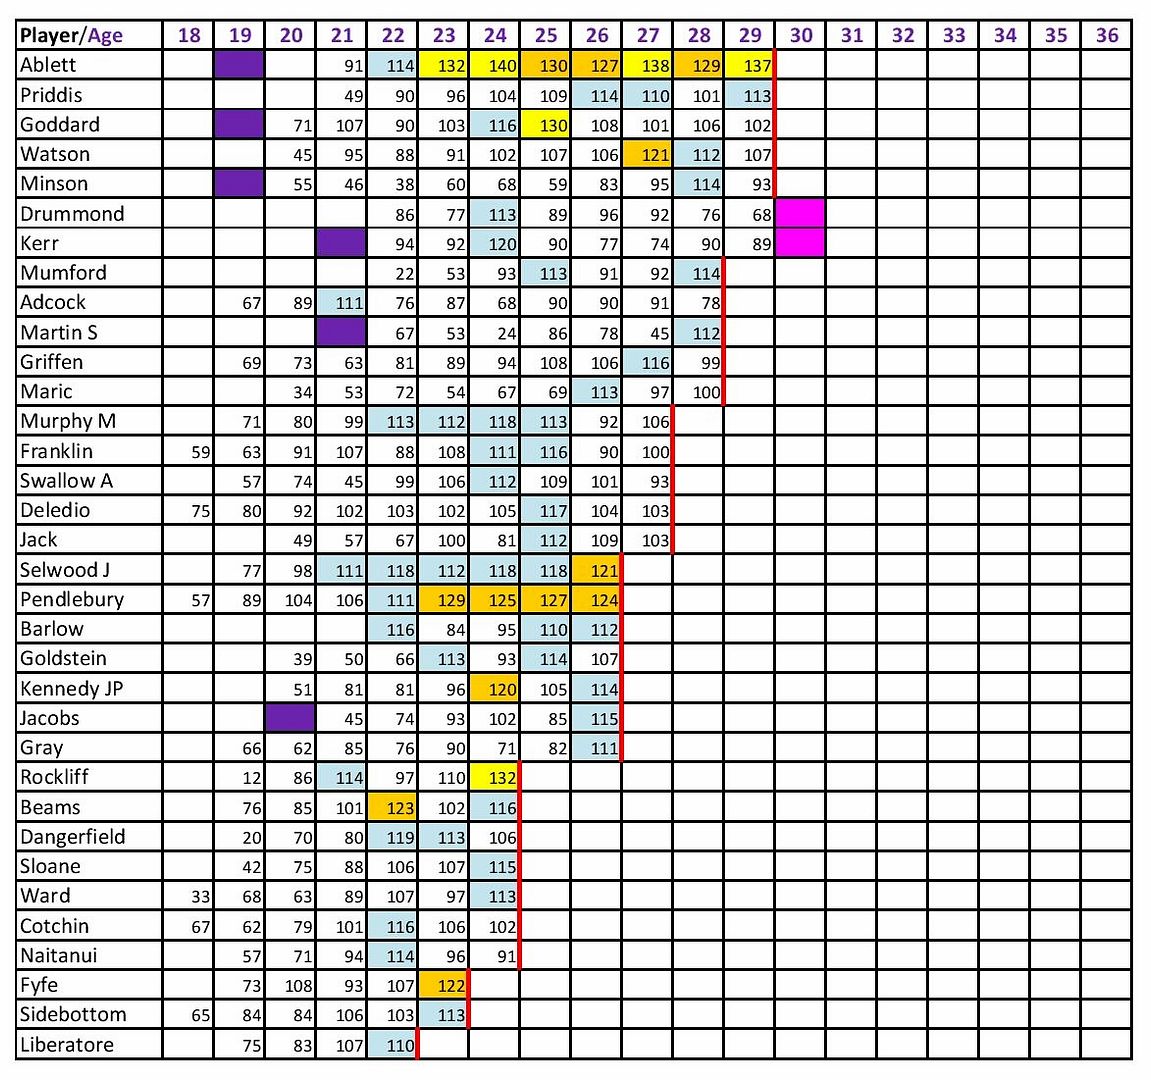
Age seems to be the favourite reason SC Coaches shy away from selecting an FP, so let's have a look at every player that has ever managed a 110+ season, and set the tables by age. Now before we start, I will concede these tables containing 68 players are mainly Mids, with a few Fwds and Rucks thrown in. The time involved in seperating the 4 positions, and setting cutoff lines for points scored to analyse is just too much for me at the moment. I am sure the principle could apply say to Defenders, you just need to do your own extrapolation on figures, and see what you are happy with. For example, you might set your Def cutoff at 95, instead of 110, and then lower the other figures we will see below accordingly.
The key to the tables

General Analysis
There are 68 players in the tables. There are 584 individual seasons recorded for the 68 players. Between them they have had 147 seasons with an average of 110+, 33 seasons with an average of 120+, and 9 seasons with an average of 130+.
Percentage wise, that works out to:
25.2% of the seasons played by these 68 players are 110+
5.7% of the seasons played by these 68 players are 120+
1.5% of the seasons played by these 68 players are 130+
If we look at the seasons played by players when they were 30 or older:
102 of the 584 seasons recorded by these players, were when the player was 30 or older. 11 of these seasons were 110+, 1 season was 120+ and 0 were 130+.
Percentage wise, for the older players, that works out to:
10.8% of the seasons played by the older players are 110+
1.0% of the seasons played by the older players are 120+
0.0% of the seasons played by the older players are 130+
That definitely points to older players "struggling" to record better seasons. The best average recorded by a 30+ player is Cox's 122 in 2011. No player at the age of 33 or older has recorded a 110+ season average. Only one of the 40 seasons recorded by players 32 and older is 110+.
There is no doubt, there is deterioration with age!
Back on track now. We are trying to see if there is an identifiable pattern for FP's.
The question can be asked, how do you define a Premium as fallen? I really think that needs to be assessed on an individual basis, and be based on reasonable expectations. There are those words again, "reasonable expectations". Fail to set or have reasonable expectations, and you will almost certainly fail somewhere in SC.
The next tables might be a bit confusing at first, but I am sure you will quickly get the hang of them.
The color key is the same for the tables above, as is the order of players. I have left the colors there so you can more easily identify what is happening for the individual players.
These tables work on a 3 year cycle. Lets call those seasons A, B and C.
We look at season "A" to see if the player achieved an average of 100+ in that season.
We then look at season "B" to see if the player dropped 5 or more in average, after recording the 100+ average the season before.
If the player met both of these conditions, we record what change occured to their average in season "C". ie the season we would hope they might bounce back from being a Fallen Premium.
Let's look at Harvey, at the top of the first table below, to give you an example.
At 29 Harvey recorded an average of 109, and at 30 he recorded an average of 112. Therefore we don't record anything in the table in his 31 year old column, as his average didn't fall by 5 or more at 30. At 30 he averaged 112, and at 31 his average fell by 24, to 88, so we want to see how he went at 32. We see his average rose by 12.7 at 32, and so you see a 12.7 in Harveys 32 year old column.
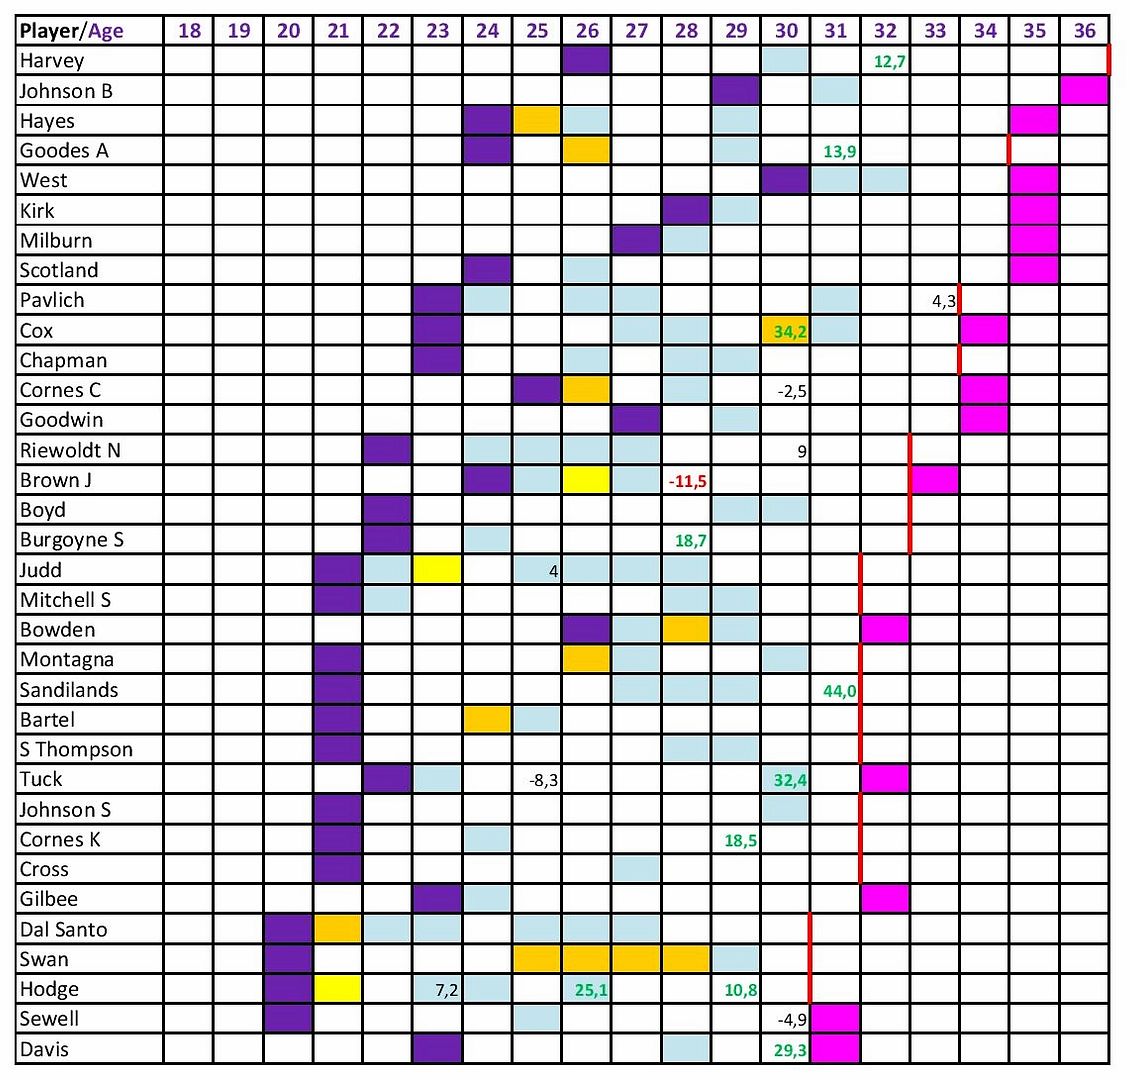
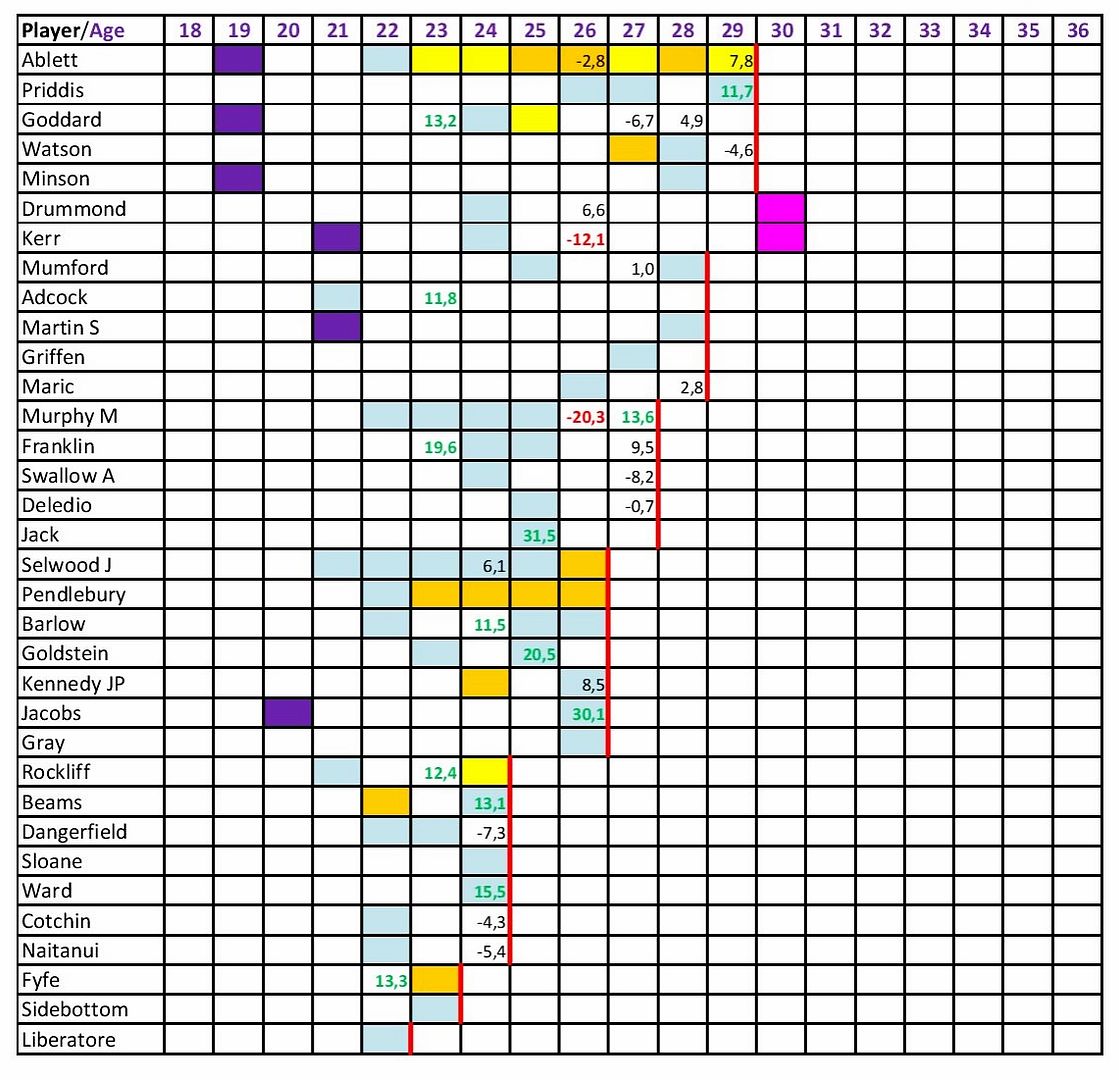
There are 104 seasons where one of the 68 players recorded a 100+ season, followed by a 5+ drop in average the following season. In 40 of these 104 seasons they recorded a 5+ increase in average from their "fallen year" (not the first year we looked at!). In 36 of the 104 their next season was within +/-5 of their "fallen year", and in 28 they fell by 5 or more again.
Lets see how those figures stack up by age.
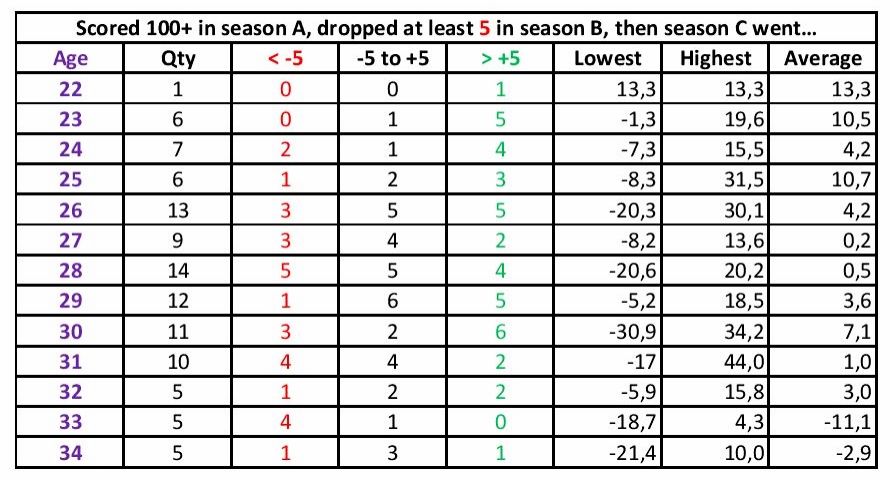
In 10 of the 14 seasons were these conditions were met by players between the ages of 22 and 24, they bounced back with a 5+ increase the following season. Interestingly, when you look at these 10 players, you can see it is really hard, even for young players to totally regain the "lost ground". Let's look at the 10 players:
Ward 107, 97, 113 to bounce back 6 higher.
Franklin 107, 88, 108 to bounce back 1 higher.
Selwood 118, 112, 118 to bounce back to the same level.
Fyfe 108, 93, 107 to bounce back 1 lower.
Rockliff 114, 97, 110 to bounce back 4 lower.
Goddard 107, 90, 103 to bounce back 4 lower.
Beams 123, 102, 116 to bounce back 7 lower.
Barlow 116, 84, 95 to bounce back 21 lower.
Hodge 135, 104, 111 to bounce back 24 lower!
Adcock 111, 76, 87 to bounce back 24 lower!
This needs to be taken as a lesson. when you are setting expectations on your FP, you should probably set them somewhere around 5 to 8 lower than the "good season", you are looking at. Don't expect them to bounce all the way back!
Looking at the players aged between 25 and 30, there 65 seasons that met the qualifying conditions (100+ season, followed by 5+ average drop.) 25 of these seasons resulted in a 5+ increase in average the following season. 24 resulted in a +/-5 average change the following season. 16 resulted in another drop of 5 or more in the subsequent season. 9 of the 25 players that increased their average in the 3rd season, also surpassed their first season of the analysis' score. 6 were close to it, and 10 fell short.
Looking at the players 31 and older, there were 25 seasons that met the qualifying conditions. Only 5 of the 25 managed to record any sort of decent "bounce" in the third season of the analysis. 10 of them finished within +/-5 of their fallen year, and 10 fell even further by 5 or more. Only once in the 5 occassions where the old player bounced back, did he bounce higher than the first season of the analysis, and that was Boomer Harvey at the age of 35, and he went higher again at 36! He's an age freak!
While a player doesn't necessarily need to bounce all the way back to his "good year" to be a worthy selection, we can see in many instances they fall short of what we want, or what we need, particularly as they get older.
The question now becomes, can we differentiate between decreasing average due to deterioration, and other causes, like injury, lost opportunity due to changes in playing personal etc?
I actually think we can. Not many players ability disappears so rapidly from one season to the next, that they go from gun to dumb (selection) in one season. It can happen, but it doesn't happen often. A player with a genuine reason for a drop of average is therefore more likely to drop more in average, than a player who is just slowly deteriorating. To demonstrate this, let's change the conditions we are looking at. Now instead of a 100+ average in season "A", and a 5+ drop in season "B", let's make it a 10+ drop in season "B", and see how the figures change. I won't reproduce the 3rd and 4th tables above, but here is the summary table by age.
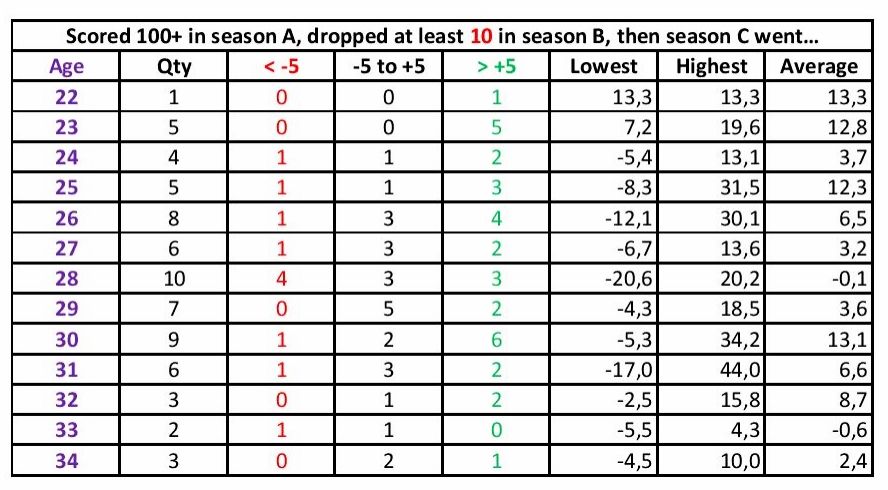
The total number of seasons has now dropped from 104 to 69. 33 of these 69 saw a bounce back of 5 or more in the third season. That's 47.8%, compared to 38.5% when we were looking at only a 5+ drop in average. 25 players within +/-5 of their fallen year, and only 11 of the 69 dropped further in average by 5 or more. That's 15.9% continued their decline, compared to 26.9% in the first table. The pattern is clear. The further they drop in the second year of the analysis, the more likely they are to bounce back in the 3rd year.
Let's push out the drop even further, and see what happens. Let's make it a 15+ drop in season "B" now.
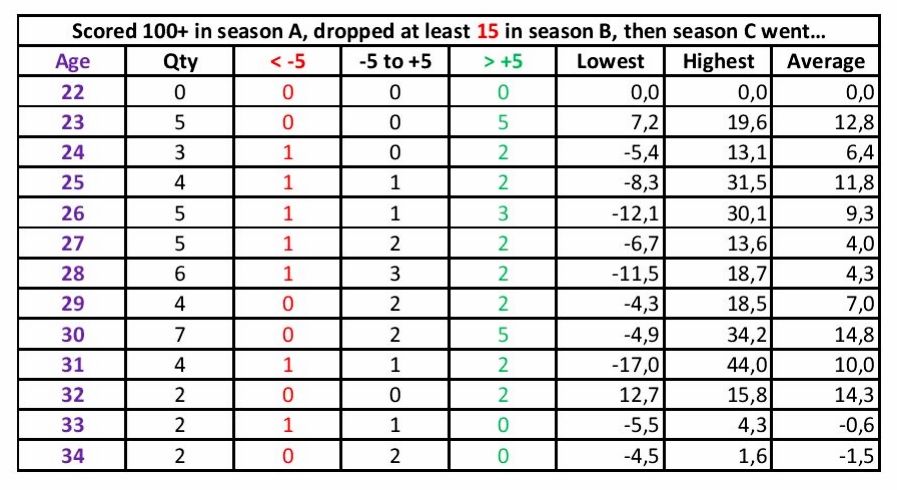
This reduces our season count to 49. 27 of them fought back with a 5+ season average in their 3rd season. That's 55.1%, way up on the 38.5% it was when we were only looking at 5+ drop in average in the first table. 7 players continued their decline, by dropping another 5+ in average in the 3rd season. 14.3% compared to 26.9% in the first table. It definitely is pushing the trend, that the further you drop in one season, the more liely you will bounce back in the next.
Let's push out the drop one more time, to 20+ in season "B".
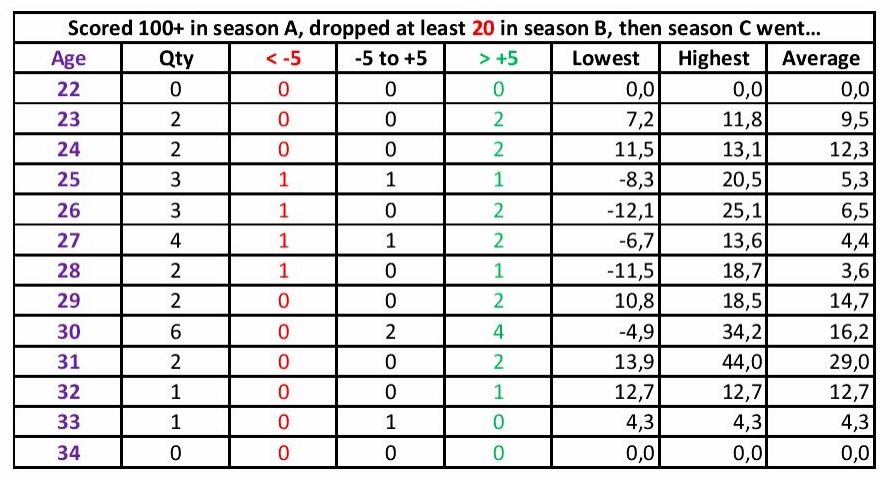
We're down to 38 seasons now. 19 of the 38 bounced back by 5+ in the third season, or 50% of them. Only 4 of them continued to decline, and fell by 5+ in the third season. That's only 10.5% compared to 26.9 in the first table. It should also be noted, that only 2 of the 19 that bounced back, bounced higher than their good year, and 1 of the 19 equalled his good year. The other 16 fell an average of 12 short of their first season. Once again, the logic seems simple. The further you fall, the more likely you are to bounce back, but the less likely you are to climb all the way back up the mountain!
Summary
Be careful with Premiums that have fallen around the 5 to 8/game area. It may be due to genuine deterioration, or the player coming off a spike year, and the season "B" average is more like their ESP (Expectected Scoring Pattern). Too many people look at the high averages players have posted, and expect they can be replicated. Only the best do that. When finding one that has fallen a decent way, like Swan, don't expect them to bounce all the way back, or even nearly all the way back. If you believe Swan is over the difficulties that saw his average fall, you are probably better to expect something like 105-107 from him this season. He is going to be 31 this season, and our history here suggests something 10 to 12 below his season "A" average would be a reasonable expectation. As I say, if you believe he has moved beyond the problems that saw his average drop. I currently have no opinion, one way or the other on that.
Also, it is important to note, that some injuries can have SC consequences across 2 seasons, not just one. Barlows broken leg springs to mind as an example of this. That is something I won't factor in, and each of you can decide for yourself where that may be applicable or not.
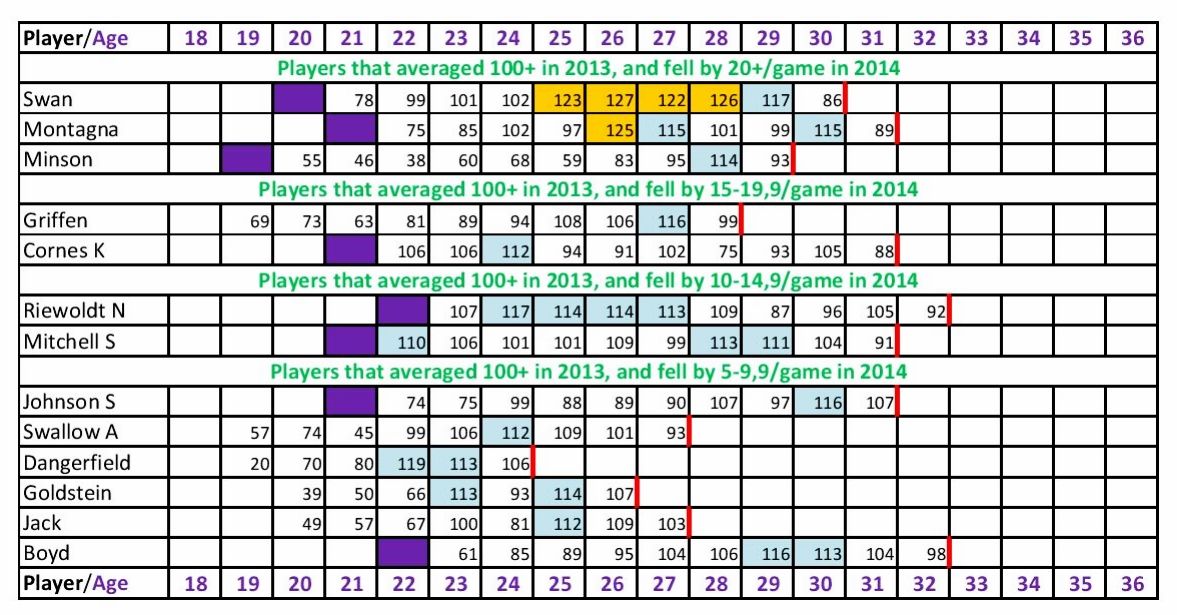
So who are the players that are in these tables, with a 5+ drop in average after the 2014 season, after recording 100+ average in 2013?
There can be many reasons a Premium falls. Loss of form. Deterioration of fitness, or ability to bounce back from hard games. Changes in role within the team. General wear and tear from years of football etc etc. Each individual SC Coach needs to decide what caused the fall, and if the player can bounce back.
Age seems to be the favourite reason SC Coaches shy away from selecting an FP, so let's have a look at every player that has ever managed a 110+ season, and set the tables by age. Now before we start, I will concede these tables containing 68 players are mainly Mids, with a few Fwds and Rucks thrown in. The time involved in seperating the 4 positions, and setting cutoff lines for points scored to analyse is just too much for me at the moment. I am sure the principle could apply say to Defenders, you just need to do your own extrapolation on figures, and see what you are happy with. For example, you might set your Def cutoff at 95, instead of 110, and then lower the other figures we will see below accordingly.
The key to the tables


General Analysis
There are 68 players in the tables. There are 584 individual seasons recorded for the 68 players. Between them they have had 147 seasons with an average of 110+, 33 seasons with an average of 120+, and 9 seasons with an average of 130+.
Percentage wise, that works out to:
25.2% of the seasons played by these 68 players are 110+
5.7% of the seasons played by these 68 players are 120+
1.5% of the seasons played by these 68 players are 130+
If we look at the seasons played by players when they were 30 or older:
102 of the 584 seasons recorded by these players, were when the player was 30 or older. 11 of these seasons were 110+, 1 season was 120+ and 0 were 130+.
Percentage wise, for the older players, that works out to:
10.8% of the seasons played by the older players are 110+
1.0% of the seasons played by the older players are 120+
0.0% of the seasons played by the older players are 130+
That definitely points to older players "struggling" to record better seasons. The best average recorded by a 30+ player is Cox's 122 in 2011. No player at the age of 33 or older has recorded a 110+ season average. Only one of the 40 seasons recorded by players 32 and older is 110+.
There is no doubt, there is deterioration with age!
Back on track now. We are trying to see if there is an identifiable pattern for FP's.
The question can be asked, how do you define a Premium as fallen? I really think that needs to be assessed on an individual basis, and be based on reasonable expectations. There are those words again, "reasonable expectations". Fail to set or have reasonable expectations, and you will almost certainly fail somewhere in SC.
The next tables might be a bit confusing at first, but I am sure you will quickly get the hang of them.
The color key is the same for the tables above, as is the order of players. I have left the colors there so you can more easily identify what is happening for the individual players.
These tables work on a 3 year cycle. Lets call those seasons A, B and C.
We look at season "A" to see if the player achieved an average of 100+ in that season.
We then look at season "B" to see if the player dropped 5 or more in average, after recording the 100+ average the season before.
If the player met both of these conditions, we record what change occured to their average in season "C". ie the season we would hope they might bounce back from being a Fallen Premium.
Let's look at Harvey, at the top of the first table below, to give you an example.
At 29 Harvey recorded an average of 109, and at 30 he recorded an average of 112. Therefore we don't record anything in the table in his 31 year old column, as his average didn't fall by 5 or more at 30. At 30 he averaged 112, and at 31 his average fell by 24, to 88, so we want to see how he went at 32. We see his average rose by 12.7 at 32, and so you see a 12.7 in Harveys 32 year old column.


There are 104 seasons where one of the 68 players recorded a 100+ season, followed by a 5+ drop in average the following season. In 40 of these 104 seasons they recorded a 5+ increase in average from their "fallen year" (not the first year we looked at!). In 36 of the 104 their next season was within +/-5 of their "fallen year", and in 28 they fell by 5 or more again.
Lets see how those figures stack up by age.

In 10 of the 14 seasons were these conditions were met by players between the ages of 22 and 24, they bounced back with a 5+ increase the following season. Interestingly, when you look at these 10 players, you can see it is really hard, even for young players to totally regain the "lost ground". Let's look at the 10 players:
Ward 107, 97, 113 to bounce back 6 higher.
Franklin 107, 88, 108 to bounce back 1 higher.
Selwood 118, 112, 118 to bounce back to the same level.
Fyfe 108, 93, 107 to bounce back 1 lower.
Rockliff 114, 97, 110 to bounce back 4 lower.
Goddard 107, 90, 103 to bounce back 4 lower.
Beams 123, 102, 116 to bounce back 7 lower.
Barlow 116, 84, 95 to bounce back 21 lower.
Hodge 135, 104, 111 to bounce back 24 lower!
Adcock 111, 76, 87 to bounce back 24 lower!
This needs to be taken as a lesson. when you are setting expectations on your FP, you should probably set them somewhere around 5 to 8 lower than the "good season", you are looking at. Don't expect them to bounce all the way back!
Looking at the players aged between 25 and 30, there 65 seasons that met the qualifying conditions (100+ season, followed by 5+ average drop.) 25 of these seasons resulted in a 5+ increase in average the following season. 24 resulted in a +/-5 average change the following season. 16 resulted in another drop of 5 or more in the subsequent season. 9 of the 25 players that increased their average in the 3rd season, also surpassed their first season of the analysis' score. 6 were close to it, and 10 fell short.
Looking at the players 31 and older, there were 25 seasons that met the qualifying conditions. Only 5 of the 25 managed to record any sort of decent "bounce" in the third season of the analysis. 10 of them finished within +/-5 of their fallen year, and 10 fell even further by 5 or more. Only once in the 5 occassions where the old player bounced back, did he bounce higher than the first season of the analysis, and that was Boomer Harvey at the age of 35, and he went higher again at 36! He's an age freak!
While a player doesn't necessarily need to bounce all the way back to his "good year" to be a worthy selection, we can see in many instances they fall short of what we want, or what we need, particularly as they get older.
The question now becomes, can we differentiate between decreasing average due to deterioration, and other causes, like injury, lost opportunity due to changes in playing personal etc?
I actually think we can. Not many players ability disappears so rapidly from one season to the next, that they go from gun to dumb (selection) in one season. It can happen, but it doesn't happen often. A player with a genuine reason for a drop of average is therefore more likely to drop more in average, than a player who is just slowly deteriorating. To demonstrate this, let's change the conditions we are looking at. Now instead of a 100+ average in season "A", and a 5+ drop in season "B", let's make it a 10+ drop in season "B", and see how the figures change. I won't reproduce the 3rd and 4th tables above, but here is the summary table by age.

The total number of seasons has now dropped from 104 to 69. 33 of these 69 saw a bounce back of 5 or more in the third season. That's 47.8%, compared to 38.5% when we were looking at only a 5+ drop in average. 25 players within +/-5 of their fallen year, and only 11 of the 69 dropped further in average by 5 or more. That's 15.9% continued their decline, compared to 26.9% in the first table. The pattern is clear. The further they drop in the second year of the analysis, the more likely they are to bounce back in the 3rd year.
Let's push out the drop even further, and see what happens. Let's make it a 15+ drop in season "B" now.

This reduces our season count to 49. 27 of them fought back with a 5+ season average in their 3rd season. That's 55.1%, way up on the 38.5% it was when we were only looking at 5+ drop in average in the first table. 7 players continued their decline, by dropping another 5+ in average in the 3rd season. 14.3% compared to 26.9% in the first table. It definitely is pushing the trend, that the further you drop in one season, the more liely you will bounce back in the next.
Let's push out the drop one more time, to 20+ in season "B".

We're down to 38 seasons now. 19 of the 38 bounced back by 5+ in the third season, or 50% of them. Only 4 of them continued to decline, and fell by 5+ in the third season. That's only 10.5% compared to 26.9 in the first table. It should also be noted, that only 2 of the 19 that bounced back, bounced higher than their good year, and 1 of the 19 equalled his good year. The other 16 fell an average of 12 short of their first season. Once again, the logic seems simple. The further you fall, the more likely you are to bounce back, but the less likely you are to climb all the way back up the mountain!
Summary
Be careful with Premiums that have fallen around the 5 to 8/game area. It may be due to genuine deterioration, or the player coming off a spike year, and the season "B" average is more like their ESP (Expectected Scoring Pattern). Too many people look at the high averages players have posted, and expect they can be replicated. Only the best do that. When finding one that has fallen a decent way, like Swan, don't expect them to bounce all the way back, or even nearly all the way back. If you believe Swan is over the difficulties that saw his average fall, you are probably better to expect something like 105-107 from him this season. He is going to be 31 this season, and our history here suggests something 10 to 12 below his season "A" average would be a reasonable expectation. As I say, if you believe he has moved beyond the problems that saw his average drop. I currently have no opinion, one way or the other on that.
Also, it is important to note, that some injuries can have SC consequences across 2 seasons, not just one. Barlows broken leg springs to mind as an example of this. That is something I won't factor in, and each of you can decide for yourself where that may be applicable or not.
So who are the players that are in these tables, with a 5+ drop in average after the 2014 season, after recording 100+ average in 2013?

Last edited:
