Discussion Tip a Top 30: Using last year's points to predict the future

KLo30

Leadership Group
Joined
27 Jan 2014
Messages
18,104
Likes
52,784
AFL Club
North Melb.
#1
Tip a Top 30: Using last year’s points to predict the future

Good on ya Mum. Tip Top’s the one. Good on ya Mum! as the ad goes for the daily loaf of bread. In Supercoachland this could easily be sung as Hey Mate. Tip, a Top 30’s the one. Good on ya Mate!

It is often stated in threads that a player is a premium. That he is locked in your side for the year, or an upgrade target to finish the side, as he’ll be a top 10 in that position at the end of the season. Often we look at the players past year and predict this to be his new norm or he’ll improve upon his previous season. He’ll regularly be from last years’ top 30. But how often is this truly the case?

Following on from Rowsus’ Chasing Last Year’s Points series and The year after being in the Top 50 averages, taking a look from a different angle, let’s look at top 30 players from 2013 and see how they fared in 2014.

Class of 2013
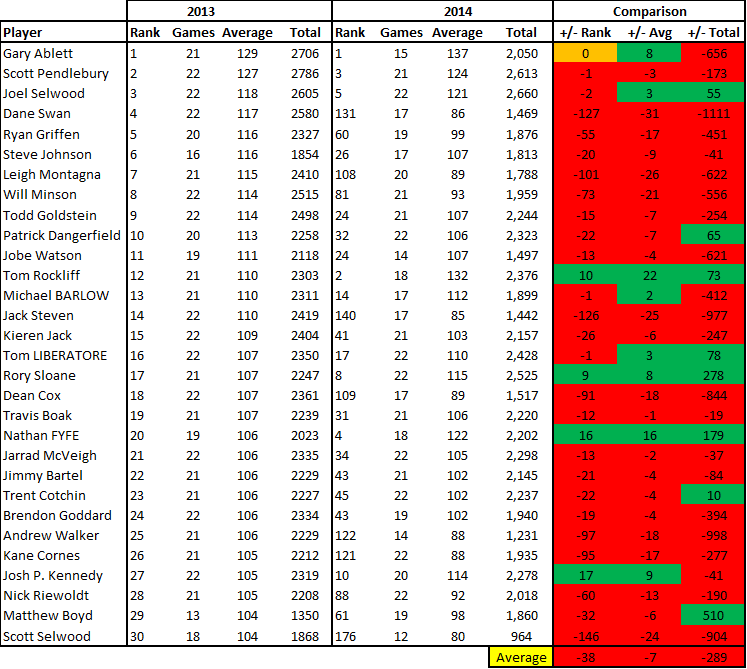

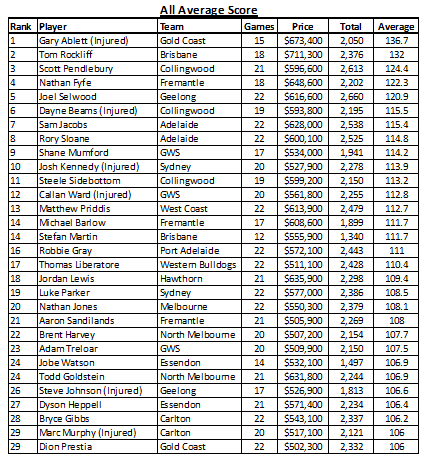
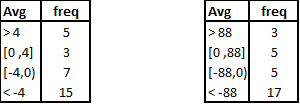
As you can see of the top 30 2013 players only 8 actually increased their average in 2014. Of which only 2 were from the top 10, one of whom was named Gary Ablett Jr. 5 of these players, Ablett, Rockliff, Sloane, Fyfe and JPK, increased their average by more than 4pts and were predicted to do so by most, and 3 Jelwood, Liberatore and Barlow, by 3pts or less. Delving further it can be seen that only 5 players with an average increase actually lead to increased points for the season. Jelwood with 55, Rockliff (73) despite 3 less games, Liberatore (78), Sloane (278) and Fyfe (179) despite 1 less game. Gary Ablett on the other hand lost 656pts against the previous season due to injury.

7 players had what you may call an acceptable decrease of 4pts or less Pendlebury, Watson, Boak, McVeigh, Bartel, Cotchin and Goddard, though Supercoachers would have been hoping for better for most. Cotchin (10) actually had an increase his total points for the season by virtue of an extra game played, with all the others losing between 37 and 621pts.

This leaves us with half the top 30 who had what would be classified as unacceptable decrease of 6pts or more, 10 of whom a 13pt or more drop off. Despite having an unacceptable decrease both Dangerfield (65) and Boyd (510) increased their seasons points total virtue of extra games played, whilst all others lost points of between 41 and 1111 (Swan).

3 of the top 10 remained so the following season, and 5, yes 5, didn’t remain within the top 30.

18 out of the 30 failed to make the top 30 the following season.


#Data used in this article was obtained from tooserious.net and footywire.com
 
Last edited:

KLo30

Leadership Group
Joined
27 Jan 2014
Messages
18,104
Likes
52,784
AFL Club
North Melb.
#2
Season 2014 was an outlier, right?

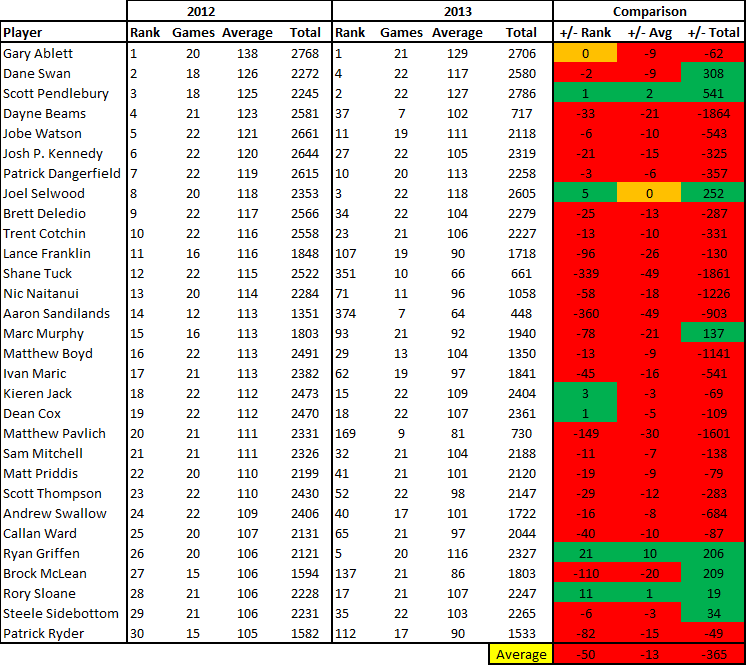
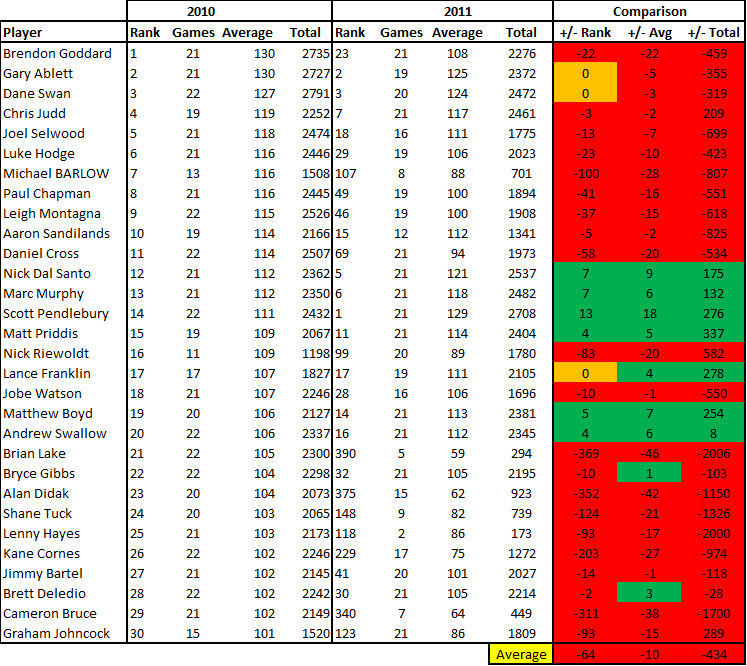
So you think season 2013 to 2014 was an outlier and that the class of 2013 was just a bad lot? Let’s introduce the classes of 2012, 2011 and 2010 with the following tables.

Class of 2012


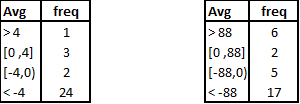
• 3 players increase average points with only 1 doing so with any significance, and 3 increasing their season total in the process
• 24 players having a decrease by 5pts or more with 3 increasing season points virtue of games played. Drop off of between 49 and 1864pts
• 4 of the top 10 remained so the following season and 2 didn’t remain within the top 30.
• 17 out of the 30 failed to make the top 30 the following season.

 
Last edited:

KLo30

Leadership Group
Joined
27 Jan 2014
Messages
18,104
Likes
52,784
AFL Club
North Melb.
#3
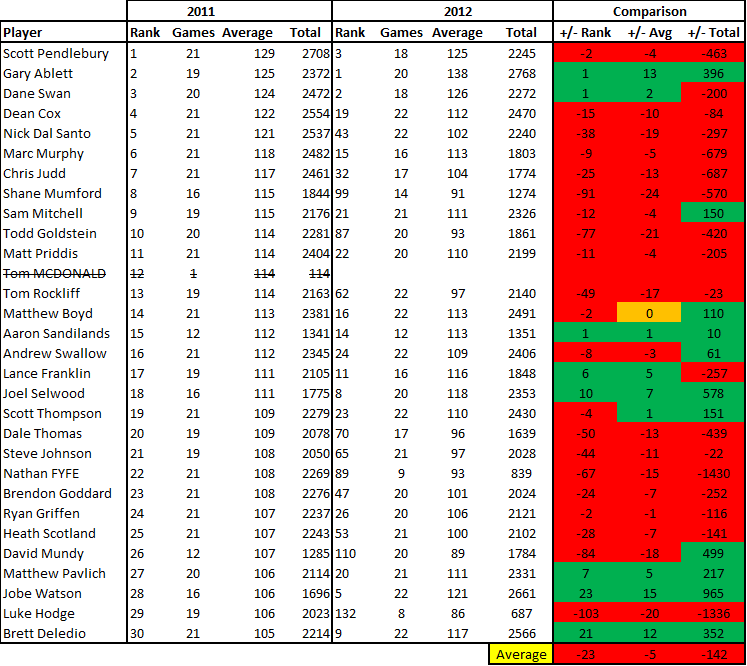
Class of 2011


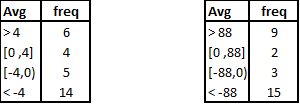
• 9 players increase average points with only 4 doing so with any significance, and 7 increasing their season total in the process
• 14 players having a decrease by 4pts or more with 2 increasing season points virtue of games played. Drop off of between 22 and 1430pts
• 3 of the top 10 remained so the following season and 4 didn’t remain within the top 30.
• 12 out of the 30 failed to make the top 30 the following season.

 
Last edited:

KLo30

Leadership Group
Joined
27 Jan 2014
Messages
18,104
Likes
52,784
AFL Club
North Melb.
#4
Class of 2010


• 9 players increase average points with 5 doing so with any significance, and 7 increasing their season total in the process
• 26 players having a decrease by 5pts or more with 3 increasing season points virtue of games played. Drop off of between 118 and 2006pts
• 3 of the top 10 remained so the following season and 3 didn’t remain within the top 30.
• 14 out of the 30 failed to make the top 30 the following season.


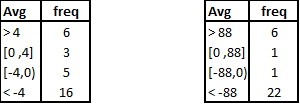
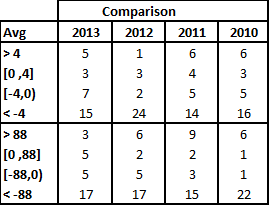
Season 2014 was an outlier, right? Well no, there seems to be a pretty defined pattern, and if you’d played the top 30 ‘double down’ in 2013 you’re probably still be having nightmares.


Furthermore, if, as a player, you are in the top 10 and your surname isn’t Ablett or Pendlebury..…. and this blew my mind…………then, on average, you have:
• only a 18% chance of staying in the top 10
• a 39% chance you’ll miss the top 10 but remain in the top 30, and
• there is a 43% chance you won’t be in the top 30 at all come season end.
 
Last edited:

KLo30

Leadership Group
Joined
27 Jan 2014
Messages
18,104
Likes
52,784
AFL Club
North Melb.
#5
What can we expect from the top 30 class of 2014 in 2015?

Using the last four years as a guide, we can expect (approximately):

Positive
• 6 players to increase their average by over 4pts
• 3 players to increase their average by up to 4pts
• 9 players out of 30 to increase their average
• 2 players to have a double figure increase
• 8 players to have an increase in their total score
• 3 of the top 10 will remain so the following season

Negative
• 5 players to decrease their average by 4pts or less
• 15 players to decrease their average by more than 4pts
• 20 players out of 30 to have a decrease in their average
• 10 players to have a double figure decrease
• 22 players to have a decrease in their total score
• 17 players to decrease their total score by more than 100pts
• 3 of the top 10 won’t remain within the top 30
• 15 players will fail to make next season’s top 30

Who will they be and why?
If you’ve read enough threads around here you’ll be familiar with the following terms, and if you aren’t you’d be wise to hit the Articles and Recommended Reading, Ruck History, Chasing Last Year’s Points (CLYP) and ceiling/(personal) history. These will allow us to find the 20 players of whom we should be wary.

Class of 2014


Remember here we’re talking about SC average and not total score. Total score is obviously influenced by injuries and suspension which are unpredictable in nature, unless your name is Steve Johnson.

Ruck History: Sam Jacobs, Shane Mumford
CLYPers: Stefan Martin, Robbie Gray, Luke Parker, Adam Treloar
(Personal) History: Tom Rockliff, Jordan Lewis, Nathan Jones, Brent Harvey, Steve Johnson, Nathan Jones
Other: Dayne Beams (new team), Tom Liberatore (#1 tagged), Gary Ablett (odd year)

That’s 15 who’ll drop in price.

Let’s throw in Fyfe (Lyon effect), Sloane (slight drop off), JPK (less efficient) , Gibbs/Murphy (one will drop out), Sidebottom (tagged down) to get ourselves to the 20, though these reasons could be attributed to anyone else on this list.

And the big one, the 3 top 10s to miss the top 30 altogether? Jacobs and Mumford are obvious contenders to drop out of the top 30 being rucks on top of the muted change to the scoring system. The other? Ross Lyon could just decide that Fyfe is the answer to his forward woes and play him in a role similar to Rockliff a few seasons ago, Justin Leppitch may find all his new pieces difficult to manage with Dayne Beams the unlucky player or JPK , the contested machine, could find a drop in disposal efficiency , a heavier tag and a return to more forward action barriers too difficult to overcome SCwise. As the lower average of the three, and for the reasons stated, I’ll say JPK.

Have I got them right? Who have I missed and why?

Who are the 15 who won’t make next season’s list?

Which 3 of the top 10 won’t make the top 30, and who’ll remain?
 
Last edited:
Joined
18 Sep 2014
Messages
848
Likes
493
AFL Club
Fremantle
#6
What can we expect from the top 30 class of 2014 in 2015?

Using the last four years as a guide, we can expect (approximately):

Positive
• 6 players to increase their average by over 4pts
• 3 players to increase their average by up to 4pts
• 9 players out of 30 to increase their average
• 2 players to have a double figure increase
• 8 players to have an increase in their total score
• 3 of the top 10 will remain so the following season

Negative
• 5 players to decrease their average by 4pts or less
• 15 players to decrease their average by more than 4pts
• 20 players out of 30 to have a decrease in their average
• 10 players to have a double figure decrease
• 22 players to have a decrease in their total score
• 17 players to decrease their total score by more than 100pts
• 3 of the top 10 won’t remain within the top 30
• 15 players will fail to make next season’s top 30

Who will they be and why?
If you’ve read enough threads around here you’ll be familiar with the following terms, and if you aren’t you’d be wise to hit the Articles and Recommended Reading, Ruck History, Chasing Last Year’s Points (CLYP) and ceiling/(personal) history. These will allow us to find the 20 players of whom we should be wary.

Class of 2014


Remember here we’re talking about SC average and not total score. Total score is obviously influenced by injuries and suspension which are unpredictable in nature, unless your name is Steve Johnson.

Ruck History: Sam Jacobs, Shane Mumford
CLYPers: Stefan Martin, Robbie Gray, Luke Parker, Adam Treloar
(Personal) History: Tom Rockliff, Jordan Lewis, Nathan Jones, Brent Harvey, Steve Johnson, Nathan Jones
Other: Dayne Beams (new team), Tom Liberatore (#1 tagged), Gary Ablett (odd year)

That’s 15 who’ll drop in price.

Let’s throw in Fyfe (Lyon effect), Sloane (slight drop off), JPK (less efficient) , Gibbs/Murphy (one will drop out), Sidebottom (tagged down) to get ourselves to the 20, though these reasons could be attributed to anyone else on this list.

And the big one, the 3 top 10s to miss the top 30 altogether? Jacobs and Mumford are obvious contenders to drop out of the top 30 being rucks on top of the muted change to the scoring system. The other? Ross Lyon could just decide that Fyfe is the answer to his forward woes and play him in a role similar to Rockliff a few seasons ago, Justin Leppitch may find all his new pieces difficult to manage with Dayne Beams the unlucky player or JPK , the contested machine, could find a drop in disposal efficiency , a heavier tag and a return to more forward action barriers too difficult to overcome SCwise. As the lower average of the three, and for the reasons stated, I’ll say JPK.

Have I got them right? Who have I missed and why?

Who are the 15 who won’t make next season’s list?

Which 3 of the top 10 won’t make the top 30, and who’ll remain?
My favourite read of the year to date.

Who are the 15 who won’t make next season’s list?
Jacobs, Mumford, S. Martin, Gray, Treloar, J.Lewis, Harvey, S. Johnson, N. Jones, Priddis, Sandilands, Heppell, Prestia, Gibbs, Sloane

Which 3 of the top 10 won’t make the top 30,
Jacobs (rucks), Mumford (rucks), Sloane (new coach)

and who’ll remain?
Pendlebury, Ablett, Selwood, Fyfe, JPK
 
Joined
30 Jul 2014
Messages
1,640
Likes
4,608
AFL Club
Sydney
#7
I can't subscribe to the theory that Parker and Treloar will drop in price.

If they were steady players who's averages last year were a statistical anomaly, then fair enough - instead they are 22 and 21 year old players whose averages have increased every year without fail. I'll concede that, much like in golf, the hardest shots to take off your handicap are the ones going from a 2 or 3 marker to a scratch marker. As with SC, the hardest points to gain are the ones that take you from 107-108 (as we see here), to the 110+ super premium range. That being said, I can see no reason why both players couldn't average 110 for this season.
 

IDIG

Leadership Group
Joined
8 Mar 2012
Messages
35,325
Likes
20,501
AFL Club
Essendon
#8
Amazing amazing amazing work Klo!

Found this lurking on BF which relates to midfielders only.

If every other year is any indication then we will see a fair few new faces in the top 10 this year.

From 2009 to 2010 - We saw 5 drop out of the top 10 for averages.
From 2010 to 2011 - We saw 6 drop out of the top 10 for average.
From 2011 to 2012 - We saw another 6 drop out of the top 10 for average.
From 2012 to 2013 - We saw another 6 drop out of the top 10 for average.
From 2013 to 2014 - We saw 7 drop out of the top 10 for averages.

For what ever reason, it seems a safe bet we could potentially see 6 new faces in the top ten based purely on averages this year. Players change roles, get old, get injured, and new players step up.

Everyone seems to be tipping at least 7 of last years top 10 to remain. History says otherwise.

Lets look at 2013 to 2014:

Top ten midfield averages from 2014:

Ablett - Finished 1st in 13'
Rockliff - Finish 11th in 13'
Pendles - Finished 2nd in 13'
Selwood - Finished 3rd in 13'
Fyfe - Finished 15th in 13'
Beams - Finished 16th in 13'
Sloane - Finished 18th in 13'
Sidebottom - Finished 30th in 13'
JPK - Finished 21st in 13'
Ward - Finish 45th in 13'
 

KLo30

Leadership Group
Joined
27 Jan 2014
Messages
18,104
Likes
52,784
AFL Club
North Melb.
#9
I can't subscribe to the theory that Parker and Treloar will drop in price.

If they were steady players who's averages last year were a statistical anomaly, then fair enough - instead they are 22 and 21 year old players whose averages have increased every year without fail. I'll concede that, much like in golf, the hardest shots to take off your handicap are the ones going from a 2 or 3 marker to a scratch marker. As with SC, the hardest points to gain are the ones that take you from 107-108 (as we see here), to the 110+ super premium range. That being said, I can see no reason why both players couldn't average 110 for this season.
In that case it's worthwhile reading Chasing last years points (MKII) and 2014 Chasing Last Years Points*, from which this quote from Rowsus should help clarify the analysis.

One of my more controversial ideas/threads.
30 players in SC history have achieved these 2 Things.
1) A 20/game increase on the previous seasons average
2) The average they avhieved with that increase is 102 or higher.
Of those 30 players, only Swan and Ablett achieved an increase in average the following year, after their 20/game jump.

The players that qualified coming into this season were:


Bringing the total to 35 players. So how did these 5 players fare? Did they beat the "curse"?
Walker 87.9 not even close!
Liberatore sitting on 110, barring accidents he'll join Swan and Ablett.
Douglas sitting on 91, so nowhere near it.
Goldstein sitting on 107, and so many of you laughed when I said the Goldy/Minson combo would be no good this year!
Steven sitting on 83, very disappointing!

I did say in one of my threads/articles, that if someone would break the "curse" this year, it would probably be Libba.
So now 35 players have achieved the cursed double, and only 3 have manged to continue some improvement the next season!
I think that definitely makes this thread worth repeating next season, to see who is cursed for 2015!
Parker and Treloar will need to become only the 4th and 5th players to do so.
 
Joined
16 Mar 2012
Messages
3,547
Likes
611
AFL Club
Carlton
#12
Nice work except I disagree with this:
JPK , the contested machine, could find a drop in disposal efficiency , a heavier tag and a return to more forward action barriers too difficult to overcome SCwise. As the lower average of the three, and for the reasons stated, I’ll say JPK.
JPK was under the most pressure per disposal of the top 50 disposal winners in 2013. I think this was probably similar in 2014 so I doubt he can cop any extra attention.

The two rucks should drop out of the top 10 but I'm not sure about the other player if there is three. I'll go with Rockliff to drop to a low 110s ave and just miss out.
 
Joined
25 Mar 2012
Messages
4,834
Likes
1,761
AFL Club
North Melb.
#13
Nice work except I disagree with this:

JPK was under the most pressure per disposal of the top 50 disposal winners in 2013. I think this was probably similar in 2014 so I doubt he can cop any extra attention.

The two rucks should drop out of the top 10 but I'm not sure about the other player if there is three. I'll go with Rockliff to drop to a low 110s ave and just miss out.
That's a huge call for a player to drop 20+ ppg and it goes against this thread.

http://www.supercoachscores.com/threads/2057-Tom-Rockliff-Real-Deal-Or-Bank-Buster
 
Joined
27 Jan 2014
Messages
6,769
Likes
14,766
AFL Club
Fremantle
#14
Awesome work KLo30. It looks like there might be a little sweet spot for players ranked between 12-20 improving the next year. I'm wondering if the change in Ruck scoring might see them buck the trend this year?
 
Joined
9 Mar 2012
Messages
10,810
Likes
16,193
AFL Club
Adelaide
#15
Wow top work KLO!! Another quality thread! Question: would it be better to exclude the rucks? Jacobs could well drop 10ppg and still potentialy be a top 4 ruck and a good pick. Seems like this is an Mid and M/F analysis and the rucks are a bit irrelevant (not attempting to critisize, just an observation).
 
Joined
18 Sep 2014
Messages
848
Likes
493
AFL Club
Fremantle
#16
Wow top work KLO!! Another quality thread! Question: would it be better to exclude the rucks? Jacobs could well drop 10ppg and still potentialy be a top 4 ruck and a good pick. Seems like this is an Mid and M/F analysis and the rucks are a bit irrelevant (not attempting to critisize, just an observation).
I think the rucks are the most important. From memory of Share Trading Theory for Rucks, you can lose a lot of points having a top 4 ruckman at R2, compared to a top 2 ruckman.

In 2010 there was 1 ruckman in the top 10 (Sandilands).

In 2011 there were 3 ruckman in the top 10 (Cox, Mummy and Goldstein). Sandilands outside the top 10 and scored over 800 points less than his previous year.

In 2012 there were 0 ruckman in the top 10 (highest Nic Nat at 14, then Sandilands at 15). Cox outside top 10 with Mummy and Goldy outside the top 80, Cox scored 84 less from more games, Mummy scored 570 less and Goldy scored 400 points less.

In 2013 there were 2 ruckman in the top 10 (Minson and Goldstein). Both outside top 70, Nic Nat scored 1200 less and Sandilands scored 900 points less.

In 2014 there were 2 ruckman in the top 10 (Jacobs and Mummy). Both outside top 20, Minson scored 550 less and Goldy scored 250 points less.

Fill the blanks as you see fit.
 

broges

100 Games Club
Joined
29 Sep 2012
Messages
633
Likes
92
AFL Club
Richmond
#17
Hats off to your fantastic work! A brilliant reminder to always seek value in our starting teams and not be lulled into thinking that previous year performances will be repeated.
 
Joined
12 Jan 2014
Messages
3,760
Likes
11,757
AFL Club
West Coast
#18
Ruck History: Sam Jacobs, Shane Mumford
CLYPers: Stefan Martin, Robbie Gray, Luke Parker, Adam Treloar
(Personal) History: Tom Rockliff, Jordan Lewis, Nathan Jones, Brent Harvey, Steve Johnson, Nathan Jones
Other: Dayne Beams (new team), Tom Liberatore (#1 tagged), Gary Ablett (odd year)

That’s 15 who’ll drop in price.

Let’s throw in Fyfe (Lyon effect), Sloane (slight drop off), JPK (less efficient) , Gibbs/Murphy (one will drop out), Sidebottom (tagged down) to get ourselves to the 20, though these reasons could be attributed to anyone else on this list.
A really great piece of research. That is why this site has it in spades over the others. Also makes me happy because at the moment my draft team only has one of the above players in it - Gablett and I can forgive him if he drops a few points.
 
Joined
20 Jan 2013
Messages
412
Likes
142
AFL Club
Brisbane
#19
A really great piece of research. That is why this site has it in spades over the others. Also makes me happy because at the moment my draft team only has one of the above players in it - Gablett and I can forgive him if he drops a few points.
Whats your team looking like then Manikato? Or is it a secret? Would be interested to see what it looks like with only one top 30 scorer in it from 2014
 
Top