Todd Goldstein

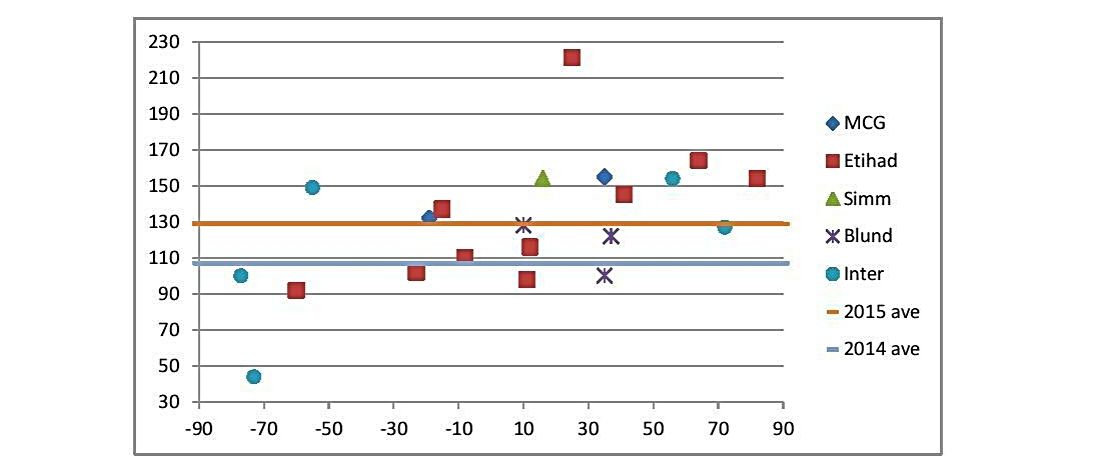
Season - 21 games at 128.8 (2014 21 games at 106.9)
MCG - 2 games at 144.5 (MCG wins 1 at 155.0, MCG losses 1 at 134.0)
Etihad - 10 games at 133.8 (Etihad wins 6 at 149.7, Etihad losses 4 at 110.0)
Simonds - 1 games at 154.0 (Simonds wins 1 at 154.0, Simonds losses 0 at 0.0)
Blundstone - 3 games at 116.7 (Blundstone wins 3 at 116.7, Blundstone losses 0 at 0.0)
Interstate - 5 games at 114.8 (Interstate wins 2 at 140.5, Interstate losses 3 at 97.7)
Wins - 13 games at 141.4
Losses - 8 games at 108.4
Of note...
It's rather a remarkable table, isn't it? 10 x 130+ scores! He averaged 137 in Victoria (151 in 8 wins, and 115 in 5 losses), and he averaged 116 outside of Victoria (126 in 5 wins, and 98 in 3 losses). I think it is absolute folly to hope he can go close to a 130 average again in 2016. There are just so many history factors against him doing it. So the question becomes, what do you think he will average? And is he worth paying top dollar for if he averages that? Even if he averages 115, you need to weigh up a potential saved trade, against the points you gained over having him in front of another Ruck, and then toss in the around $130k you saved by bringing Goldy in later. It's a tough equation to work out! Goldstein plays 3 of his first 5 games Interstate: Rnd 2 Brisbane at the Gabba, Rnd 3 Melbourne at Blundstone, Gold Coast at Metricon. Their other 6 games in the first 9 are all at Etihad. Then from Rounds 10 to 16 they play 4 Interstate, and 2 at Etihad. So in their first 15 games it 7 Interstate, and 8 at Etihad!
For those interested in the numbers:
Small grounds 12 at 132.7 (150 in 7 wins, 108 in 5 losses)
Medium grounds 4 at 118.5 (140 in 2 wins, 97 in 2 losses)
Large grounds 5 at 127.8 (126 in 4 wins, 134 in 1 loss)
Their Draw is: SMLSMSSSSSLSSS[bye]MSSSSLLS
Interstate games
So what is this history I am talking about?
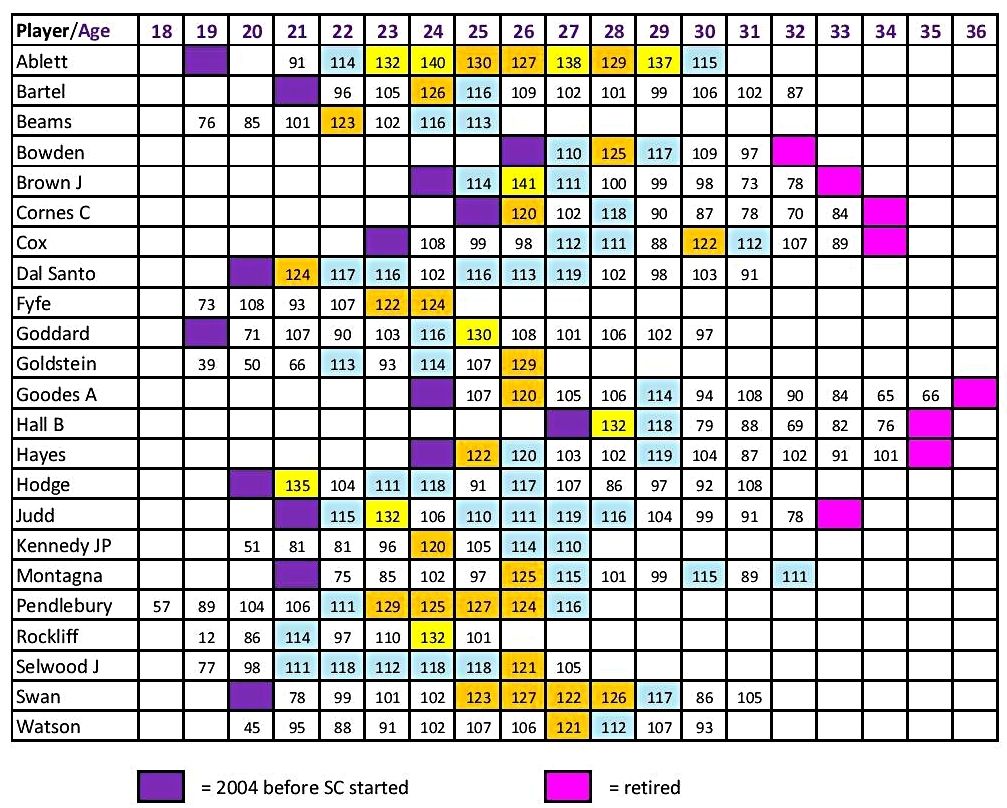
Here is a table of every player to ever average 120+ in a season in SC.
The table is sorted alphabetically, and shows what age they were when the season started.

In this table of 23 players, we can see only 4 players have recorded more than one 120+ season: Ablett (7), Swan (4), Pendlebury (4), Fyfe (2). Straight away we can see, that if Goldy is to go 120+ again, ever, he is joining pretty elite company. If you look at how these players have faired since they recorded their first 120+ season, they have played between them a further 120 seasons. Those 120 seasons average out at 104. In those 120 seasons there are:
13 seasons that were 120+ (the 4 players listed above)
32 seasons that were between 110 and 120
36 seasons that were between 100 and 110
39 seasons that were below 100
The 21 players that have recorded a 120+ season then recorded a season below 120 have averaged a drop of 16/game.
Looking at all 34 seasons where a player has averaged 120+, then played a subsequent season, the average drop is just under 10/game.
Bottom line, 120+, there are 19 one timers, and 4 multiples, and the multiples are the elite of the elite Midfielders.
Since 2007, how has the number 1 Ruck fared the following season?
2007 Cox 99 - top Ruck again 112
2008 Cox 112 - top average 111, but 13th in aggregate (11 games)
2009 Cox (ave) 111, Clark (agg) 2063 - Cox 4th ave 88, Clark 13th agg 1384 (19 games)
2010 Sandilands 114 - 4th ave 111, 16th agg 1440 (13 games)
2011 Cox 122 - 4th ave 112, 1st agg 2470
2012 NicNat (ave) 114, Cox (agg) 2470 - NicNat 8th ave 96, Cox 3rd agg 2351
2013 Minson 114 - 9th ave 93, 6th agg 1959
2014 Jacobs 115 - 4th ave 107, 2nd agg 2267
It is possible that Goldy is about to embark on a Cox like domination of the Rucking tables, but even if he does, history suggests it is more likely to be a 115 ave, than a 120+ that will get him there. We can see from that list, not too many number one Rucks back it up from season to season.

Season - 21 games at 128.8 (2014 21 games at 106.9)
MCG - 2 games at 144.5 (MCG wins 1 at 155.0, MCG losses 1 at 134.0)
Etihad - 10 games at 133.8 (Etihad wins 6 at 149.7, Etihad losses 4 at 110.0)
Simonds - 1 games at 154.0 (Simonds wins 1 at 154.0, Simonds losses 0 at 0.0)
Blundstone - 3 games at 116.7 (Blundstone wins 3 at 116.7, Blundstone losses 0 at 0.0)
Interstate - 5 games at 114.8 (Interstate wins 2 at 140.5, Interstate losses 3 at 97.7)
Wins - 13 games at 141.4
Losses - 8 games at 108.4
Of note...
It's rather a remarkable table, isn't it? 10 x 130+ scores! He averaged 137 in Victoria (151 in 8 wins, and 115 in 5 losses), and he averaged 116 outside of Victoria (126 in 5 wins, and 98 in 3 losses). I think it is absolute folly to hope he can go close to a 130 average again in 2016. There are just so many history factors against him doing it. So the question becomes, what do you think he will average? And is he worth paying top dollar for if he averages that? Even if he averages 115, you need to weigh up a potential saved trade, against the points you gained over having him in front of another Ruck, and then toss in the around $130k you saved by bringing Goldy in later. It's a tough equation to work out! Goldstein plays 3 of his first 5 games Interstate: Rnd 2 Brisbane at the Gabba, Rnd 3 Melbourne at Blundstone, Gold Coast at Metricon. Their other 6 games in the first 9 are all at Etihad. Then from Rounds 10 to 16 they play 4 Interstate, and 2 at Etihad. So in their first 15 games it 7 Interstate, and 8 at Etihad!
For those interested in the numbers:
Small grounds 12 at 132.7 (150 in 7 wins, 108 in 5 losses)
Medium grounds 4 at 118.5 (140 in 2 wins, 97 in 2 losses)
Large grounds 5 at 127.8 (126 in 4 wins, 134 in 1 loss)
Their Draw is: SMLSMSSSSSLSSS[bye]MSSSSLLS
Interstate games
So what is this history I am talking about?
Here is a table of every player to ever average 120+ in a season in SC.
The table is sorted alphabetically, and shows what age they were when the season started.

In this table of 23 players, we can see only 4 players have recorded more than one 120+ season: Ablett (7), Swan (4), Pendlebury (4), Fyfe (2). Straight away we can see, that if Goldy is to go 120+ again, ever, he is joining pretty elite company. If you look at how these players have faired since they recorded their first 120+ season, they have played between them a further 120 seasons. Those 120 seasons average out at 104. In those 120 seasons there are:
13 seasons that were 120+ (the 4 players listed above)
32 seasons that were between 110 and 120
36 seasons that were between 100 and 110
39 seasons that were below 100
The 21 players that have recorded a 120+ season then recorded a season below 120 have averaged a drop of 16/game.
Looking at all 34 seasons where a player has averaged 120+, then played a subsequent season, the average drop is just under 10/game.
Bottom line, 120+, there are 19 one timers, and 4 multiples, and the multiples are the elite of the elite Midfielders.
Since 2007, how has the number 1 Ruck fared the following season?
2007 Cox 99 - top Ruck again 112
2008 Cox 112 - top average 111, but 13th in aggregate (11 games)
2009 Cox (ave) 111, Clark (agg) 2063 - Cox 4th ave 88, Clark 13th agg 1384 (19 games)
2010 Sandilands 114 - 4th ave 111, 16th agg 1440 (13 games)
2011 Cox 122 - 4th ave 112, 1st agg 2470
2012 NicNat (ave) 114, Cox (agg) 2470 - NicNat 8th ave 96, Cox 3rd agg 2351
2013 Minson 114 - 9th ave 93, 6th agg 1959
2014 Jacobs 115 - 4th ave 107, 2nd agg 2267
It is possible that Goldy is about to embark on a Cox like domination of the Rucking tables, but even if he does, history suggests it is more likely to be a 115 ave, than a 120+ that will get him there. We can see from that list, not too many number one Rucks back it up from season to season.
Last edited:
