Hi nico,
sorry it's taken me so long to get back to you. Life getting in the way, and all that.
I think
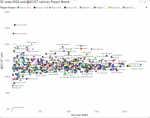
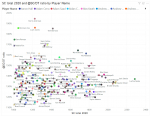
@Darkie has given you some very useful leads in this. With the tables you produced, to compare SC to DT, I would drop out all the players that weren't SC revelant, or just below SC relevant, then look at how it stacks up. As Darkie was very eloquently expressed, the shorter Qtrs, combined with a need to allocate 3300 points, means some of the larger scores get pushed higher, and some of the lower scores get pushed comparatively lower.
As to scaling effect, most of the scaling is actually done "in the run". Someone like
@Erich1036 or
@Bontempele can probably explain this better, as they have a really good grasp of the make up of a SC score. Here is my understanding of the "in the run" scaling. I will use an overly simple example, just to make it easier for me to explain. The aim is to get each quarter to total roughly 825 points. Now imagine 2 scenarios:
Scenario 1: The game is an untidy tussle, with lots of stoppages, and few clean effective disposals. As we get to, just for example, to 20% of the way through the 1st quarter, there have only been a total of 140 points allocated, including Aspen on 25 points, Brash on 10 points, and Carter on 4 points. (As far as I know, this isn't done at particular points in the quarter, but just done as the quarter progresses.) At 1/5 of the way through the quarter, there should be around 165 points allocated. So everyone's score is bumped by a factor 165/140. So Aspen goes from 25 to 29.5, Brash from 10 to 11.8, and Carter from 4 to 4.7. As we can see, while the scaling was proportional, Aspen was by far the biggest beneficiary.
Scenario 2: Same players, same scores, but it's been open, free flowing, and lots of points allocated. In fact, 20% of the way through the Qtr, there has been 180 points allocated. The same scaling process kicks in, trying to reduce the total to 165 points again. So Aspen goes from 25 to 22.9, Brash goes from 10 to 9.2, and Carter goes from 4 to 3.7.
To the best of my knowledge, this why you can see a players score creeping up, or conversely, going down, when they haven't touched the ball, or aren't even on the ground. What we found last year was, the players that had impact early were getting scaled up a lot in the run of the game. As we saw in the 2 scenarios above, the higher scorers benefit greatly from this kind of scaling. When you factor in the Qtrs were 20% shorter, there was obviously a lot more scaling up going on, than scaling down. I think
@Darkie 's estimate of it generally being in the 5% to 10% more than we might normally have seen is probably pretty close, but there will be instances where it is even higher. This also goes a long way to explaining, how players with lowish numbers, that might normally translate to 90 or 95 scores, ended up with much higher scores, as they might have had the score impacting plays early in the quarter, which will possibly have a slightly better nett effect on the score, than doing it late in the quarter. (unless it is late in the last quarter, with the game still on the line.). It can happen that within the one quarter it is going slowly, then suddenly speeds up, as far as allocated points are concerned. In this scenario, it is the "raw" scores that get adjusted in the required direction, and not the "new adjusted scores".
While some players obviously benefitted more than others (Gawn and Neale obviously spring to mind), it is interesting to compare the top CO players from 2019 and 2020.
2019 - The top 5 CP winners averaged 15.9 CP's/game, 28.9 Disps with a DE of 72.1%, SC 113.5, DT 100.9
2020 - The top 5 CP winners averaged 12.5 CP's/game, 23.1 Disps with a DE of 66.0%, SC 118.7, DT 87.0
With shorter Qtrs all their numbers were down, including the DE%, SC went up 4%, but DT went down 14%. All the key scoring areas were down similarly. Marks 3.34 to 3.04, Tackles 4.44 to 4.2, Goals 0.57 to 0.51. This is just looking at those 5 top CP players.
There is no definitive answer, as to how you might adjust their scores. Maybe make a sliding scale, marking all the the 110+ averages down between 7% at the top, sliding to 1% at the 110 mark. It's not easy for you, I know. The other option is just to * the season, and move on.
Good luck, and continue your great work!


