Analysis 2024 AFL SC: Rolling Perfect Team [Post #242 onwards]

Joined
20 Jan 2016
Messages
570
Likes
2,848
AFL Club
Hawthorn
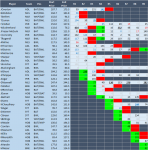
The team currently leading is entitled "Nuke". Here is what they have done.

My observations.
  • Used maximum possible trades to date so only 6 left.
  • Has 9 mid premiums, 5 def premiums & 5 fwd premiums (6 if you count Sexton)
  • Yet to miss a captain. Averaging 136 with a lowest of 109.
View attachment 74451
Thanks for that.
136 captain average, I thought that was crazy then added up mine and the exact same 136 avg, 109 lowest.
Certainly burned through those trades, used all 5 boosts straight up and only 5 premiums have stayed in their team from the start.
Trading in Houston this week saved their round.

The team coming 3rd looks in good position, high team value and 23 premiums.
 
Joined
9 Feb 2015
Messages
9,440
Likes
57,906
AFL Club
West Coast
That's very interesting to analyse, a few things I notice immediately :-

Just 2 starting premium mids remained in his team all year - Bont & Green

Flanders the only premium fwd to remain in his team all year

Grundy > Xerri trade round 3 when Grundy was on the bye a huge move

E Phillips, Drury & Hardeman wasted trades but moved on from them quickly - the advantage of having 40 trades.

Played a hard & fast game overall which is required these days if wanting to be a chance at the overall.
 
Joined
22 Oct 2014
Messages
7,882
Likes
41,730
AFL Club
North Melb.
The thing I noticed is 4 trades left with 8 rounds to go and 2 with 6 rounds to go. I had 7 left with 8 rounds to go and ended up with 6 doughnuts in the last 2 rounds. They avoided most of the late season injuries and only traded out Gawn (R18), Fisher (R20) and Sheezel (R23).
 
Joined
9 Dec 2020
Messages
2,370
Likes
12,058
AFL Club
Essendon
The thing I noticed is 4 trades left with 8 rounds to go and 2 with 6 rounds to go. I had 7 left with 8 rounds to go and ended up with 6 doughnuts in the last 2 rounds. They avoided most of the late season injuries and only traded out Gawn (R18), Fisher (R20) and Sheezel (R23).
Just goes to show the luck element that is needed alongside good trading. So many teams bottomed out from those injuries but if they don't hit your players, your coast a lot more.
 
Joined
1 Feb 2016
Messages
106
Likes
808
AFL Club
Essendon
Never had Ryan, Butters or Serong. Carried Young and Green despite the question marks on their scoring. Yet traded NMartin out and then back in again.
Unbelievable guts to do that! Definitely a deserving winner on that alone I think. I felt a lot of pressure to get Ryan and in hindsight it was probably the wrong move. (Started Serong and had Butters early).
 
Joined
27 Jan 2014
Messages
6,769
Likes
14,766
AFL Club
Fremantle
Unbelievable guts to do that! Definitely a deserving winner on that alone I think. I felt a lot of pressure to get Ryan and in hindsight it was probably the wrong move. (Started Serong and had Butters early).
Luck as well. If the dockers hadn't tweaked their game plan not having Ryan would have made it hard for him to win. The point is that trading Ryan in wasn't helping him pass those that already had Ryan. He had no choice but to bet against Ryan with the understanding that he could keep falling behind. You have to be prepared to fail as well as succeed.
 
Joined
8 Aug 2012
Messages
418
Likes
2,699
AFL Club
Bulldogs
When I looked at the winner's team Caleb Windsor Knot (CWK) across the season, my first thought was that it wasnt that different to my squad as it evolved across the season.
But I finished a lousy 36,086th and was more than 4000 points behind.:mad:
With some help from @Beg2Differ - thanks again - I was able to run a few comparative macros over my files.

A few observations from that analysis..
* The winner used 67 different players across the season - I had used 43 of them - an overlap of about 64%
There are about 5-7 meaningless players in the CWK squad (Gibcus, Drury, Hardeman etc) so the meaningful overlap is probably around 70%

* We started 19 of the same players - the number fluctuated but the average overlap was about 17.5 players.

* if you do the raw overlap - 24 rounds by 30 players - my team overlapped 417 times out of 720 - nearly 58%

* the overlap of just the scoring players is approx 61%

Now I did some dumb things with captains & emergencies that probably cost me 200-300 points but thats peanuts compared to the 4,000 pt deficit.

I'm still trying to grasp how I could get that far behind - I think its fair to say that the winner and I were mostly on the same wavelength - so without examing the individual player differences too much, you'd that the "unique" players we respectively used wouldn't be that different.
Moreover not every divergence would be a case whereby the winner got a better result... eg I started Xerri and Heeney whereas CWK used early trades on them, I started Nick Martin and didnt waste trades (CWK dropped him after R1 and brought him back in R4)

One rationalisation is that being 4,000 points behind means my total score represents about 92.3% of the winners total..
BUT - It still seems like that gap is ginormous..
 
Top