
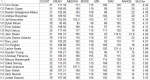
Analysis SCS Predicted Averages 2025
- Thread starter Ironhawk
- Start date
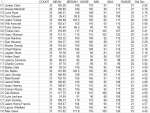
Very interesting; not sure how to interpret this analysis. I calculate std dev's each round for the players I have in my keeper leagues. The averages from just eyeballing (I have many of the top end players in your data set) for D's are about 25, M's maybe 28, and F's closer to 30.
So while the responders are often almost unanimous, across the season the players scores will display far more variation. Not a criticism more an observation.
So while the responders are often almost unanimous, across the season the players scores will display far more variation. Not a criticism more an observation.
- Joined
- 3 May 2017
- Messages
- 2,696
- Likes
- 8,946
- AFL Club
- Hawthorn
Very interesting; not sure how to interpret this analysis. I calculate std dev's each round for the players I have in my keeper leagues. The averages from just eyeballing (I have many of the top end players in your data set) for D's are about 25, M's maybe 28, and F's closer to 30.
So while the responders are often almost unanimous, across the season the players scores will display far more variation. Not a criticism more an observation.
So while the responders are often almost unanimous, across the season the players scores will display far more variation. Not a criticism more an observation.
Where there is high certainty and good expected l deal, you'd take that over less certainty with a similar expected return. Eg Hayden Young over a similar priced expected points salary deal.
Last edited:
I'm not sure Standard Deviations are much suited to this format, and using Bontempelli as an example shows perfectly why.
Bontempelli predicted average 120.4 - Standard Deviation 3.74.
Using this in a pure mathematical way, it says that Bontempelli is a 99.7% chance of averaging 110+.
Blind Freddie can see this is impractical. It basically says if Bontempelli played the 2025 season 1,000 times, he will only drop below a season average of 110 three times!!!
When you look at a truncated version of a typical 120.4 season average, we see the player will have scores in the following ranges:
Scores 0 - 86 = 2 scores averaging 69 (138)
Scores 87-110 = 5 scores averaging 98 (490)
Scores 111-134 = 8 scores averaging 120 (960)
Scores 135-156 = 5 scores averaging 144 (720)
Scores 157-240 = 2 scores averaging 170 (340)
Total 2,648 / 22 = 120.36
That shows nearly a third of his games (7) totalling 1060 (average 151.4). While these sort of numbers have obviously been achieved before, it does demonstrate how "fragile" it is. It doesn't need to have too much go awry for the wheels of that 120 average to fall off. An extra niggle or two. A couple of forced "dud" roles, with more Fwd time due to team structure. A few effective tags. All adds up that you can see Bont falling below 110 more than 3 times in a thousand attempts at this season.
- Joined
- 31 Mar 2014
- Messages
- 2,914
- Likes
- 2,130
- AFL Club
- Brisbane
J
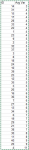
How Might we know what our ID was?
Want to know on average how close your estimates were to the mean? Work out which ID# relates to your submission and match it up below.
View attachment 84011
View attachment 84011
- Joined
- 31 Mar 2014
- Messages
- 2,914
- Likes
- 2,130
- AFL Club
- Brisbane
I can tell anyone who wants to know, as I have the list. Some people may not want everyone to know how they think specific players may score.
Ask here if you don't care if everyone knows your ID, I can also let anyone know via PM if that's preferred.
Ask here if you don't care if everyone knows your ID, I can also let anyone know via PM if that's preferred.
I found the standard deviation data interesting - but I don’t think we can really compare the variation in individual coach’s estimates of season-long averages, against game-by-game variation in scores, or variation in actual season averages.
To use an example, if we had a fair coin and said we were going to flip it 100 times, and asked everyone to guess how many times it would come up heads:
- Each individual response* should really be 50.
- In that scenario, the standard deviation of estimates would be zero.
- That would be the case even though there is a very high chance that the estimate isn’t ultimately correct (>50 or <50 heads come up) … ie 50 remains clearly the best guess, even though it will probably be wrong!
The standard deviation of estimates relates to the uncertainty of what the best guess is, rather than the uncertainty of the actual outcome.
* This assumes each coach is trying to estimate as accurately as they can, rather than strategically choosing a POD option (as they might if it was a ‘nearest the pin’ contest).
Fire away thanks @Ironhawk, here is fine.
Here is fine for me also ")
Something I note is the "conservatism" of projecting premiums. Basically every single premium we've projected to decline, I would bet anything that at least one of them improves by a significant amount!
Funny looking at the range tables how it basically goes from irrelevant to relevant guys pretty quickly as well!
What will be most interesting for this, imo, is the end of year review to see how accurate people are. Definitely a few that I'd have changed already on a couple of weeks extra information as well.
Great work all.