Opinion Rowsus Tables And Analysis Of 2015 Season

Rowsus

Statistician
Joined
19 Mar 2012
Messages
29,137
Likes
64,907
AFL Club
Melbourne
#41
Aaron Sandilands


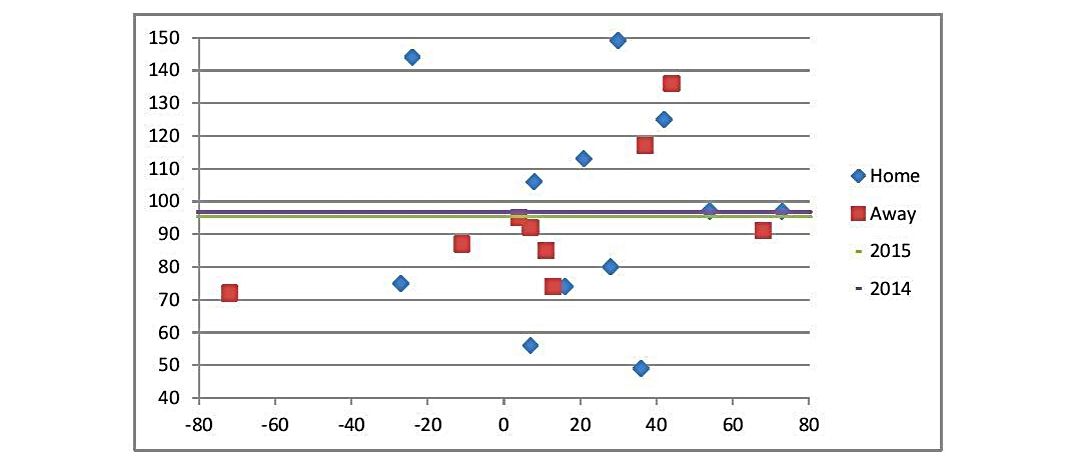
Season - 21 games at 107.8 (2014 21 games at 108.0)
Home - 12 games at 108.5 (Home wins 10 at 102.4, Home losses 2 at 139.0)
Away - 9 games at 106.9 (Away wins 7 at 103.0, Away 2 losses at 120.5)
Wins - 17 games at 102.6
Losses - 4 games at 129.8

Of note...
Ok, time to float a new theory. Alright, it's not new, but I haven't seen it actually quantified before! It has uses beyond just Rucks, but Sandilands should be a great example to use for quantifying this theory.
There would seem to be 4 major factors in how a Ruck performs in SC.
1) Is he a lone Ruck?
2) The quality of the opponent/s he is up against that week.
3) The weather, which when wet can lead to more stoppages/Ruck contests.
The fourth affects some Rucks more than others, and Sandilands being a big lumbering dinosaur is going to be more affected than a Goldstein type, that is more mobile, and a Blicavs, who is more athletic.
4) Size of ground!
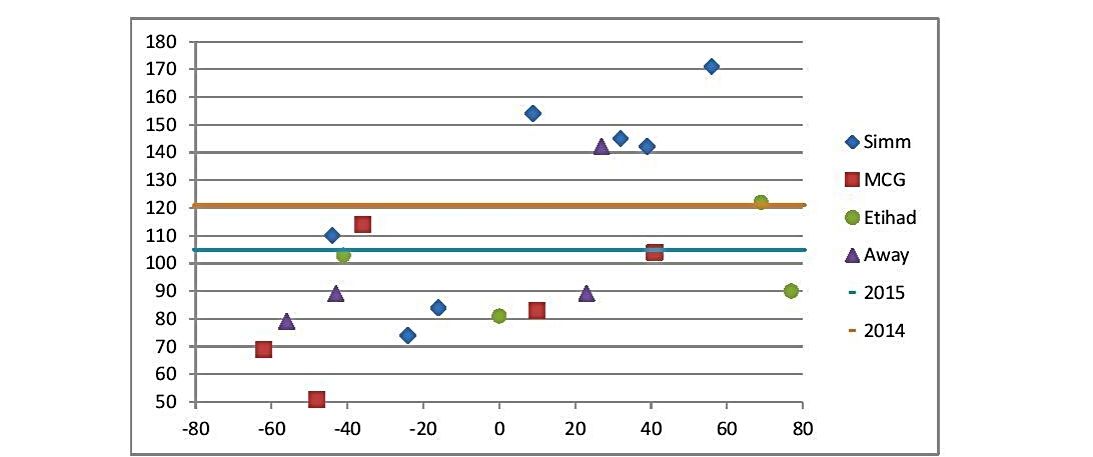
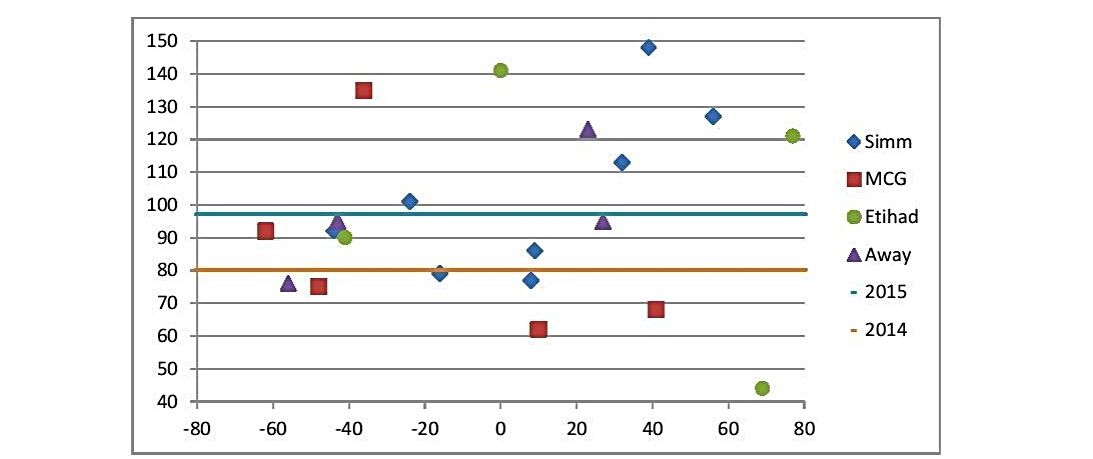
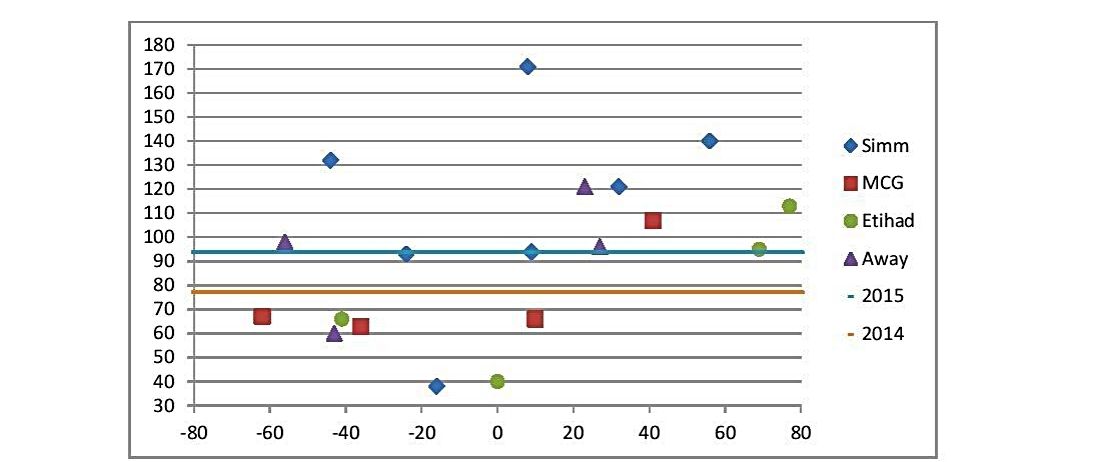
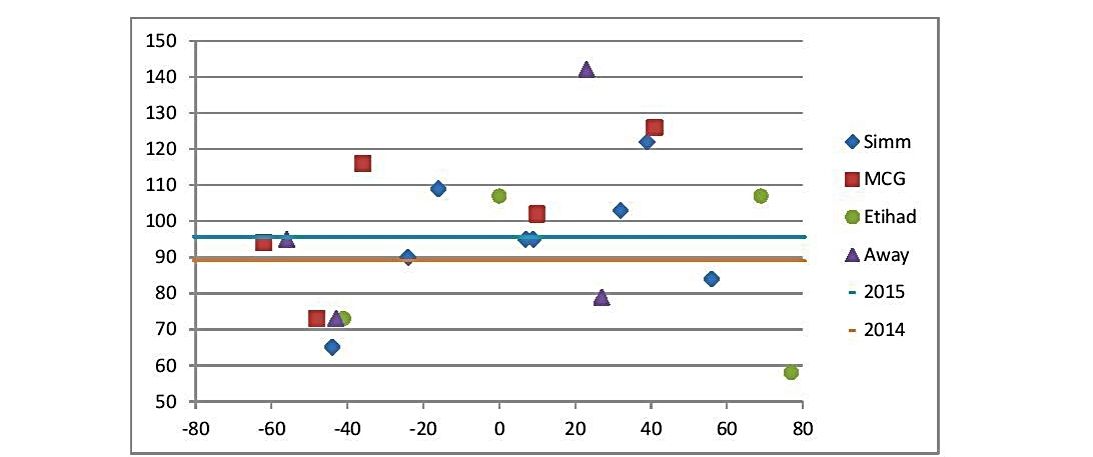
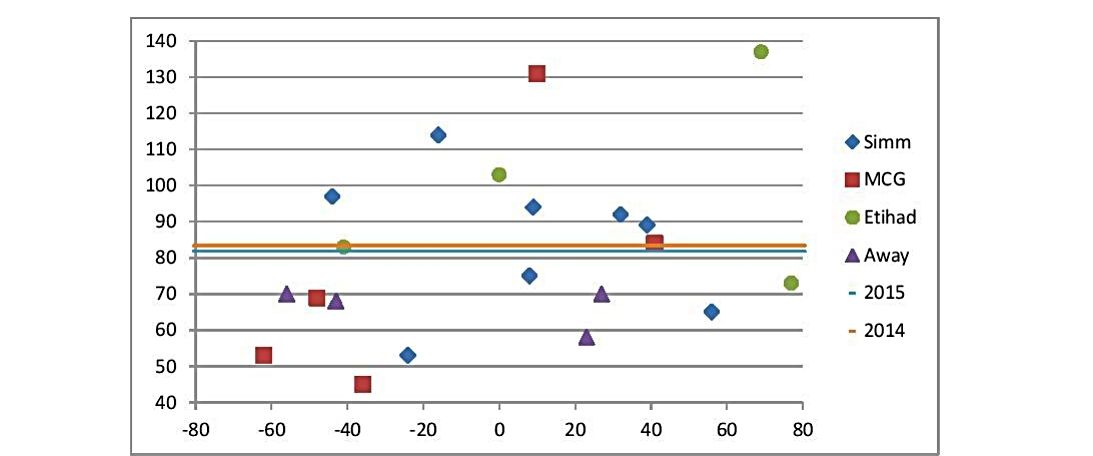
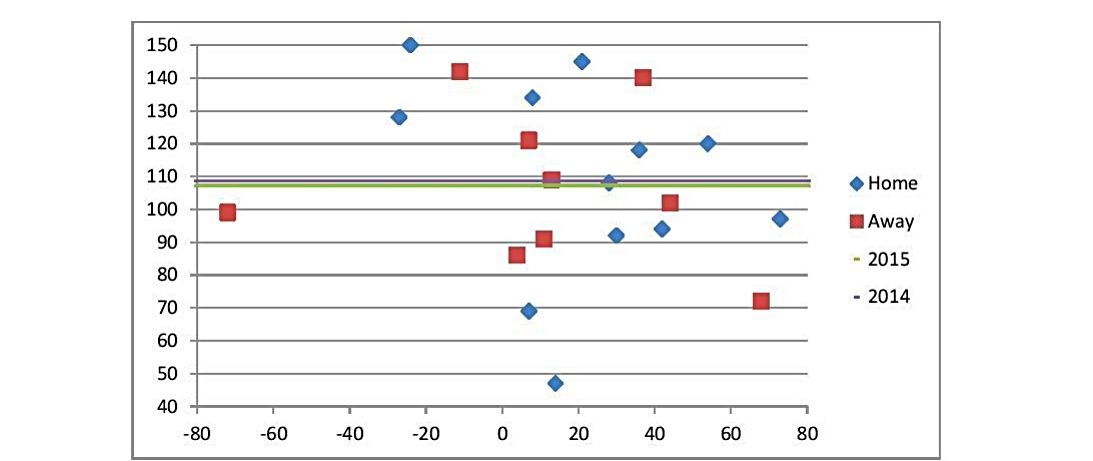
Let's break Sandilands 2015 into three catagories: Grounds significantly smaller than Domain, grounds around the same size, and grounds significantly larger than Domain. The number in brackets after the ground is the square metre size of the ground
Smaller: Etihad x 3 (16,141), Adelaide (16,139), Simmonds (15,361)
Scores - 142, 140, 109, 102, 91 - ave 116.8
Similar: Domain (16,775) x 12, Metricon (16,846)
Scores - 150, 145, 134, 128, 121, 120, 118, 108, 97, 94, 92, 69, 47 - ave 109.5
Larger: MCG x 2 (17,726), Aurora (17,502)
Scores - 99, 86, 72 - ave 85.7
As I said, it is one of 4 factors, and will affect some players more than others. The opposite applies in some cases, where a player that relies on his run/speed/tank for good scores can suffer on smaller grounds. To hammer the point home further with Sandilands, let's look at the games on the smaller and larger grounds.
Smaller
Rnd 2 - 102 vs Geelong at Simmonds. Opponents Simpson, Stanley, Blicavs. Sandi had 51 of 93 recorded H/outs.
Rnd 7 - 109 vs WBull at Etihad. Opponent Cordy. Sandi had 50 of 82 recorded H/outs
Rnd 9 - 91 vs Adelaide at Adelaide. Opponent Jacobs. Sandi had 69 of 113 recorded H/outs
Rnd 19 - 140 vs St Kilda at Etihad. Opponent Hickey. Sandi had 38 of 74 recorded H/outs
Rnd 21 - 142 vs North at Etihad. Opponent Goldstein. Sandi had 43 of 82 recorded H/outs
Larger
Rnd 5 - 72 vs Melbourne at MCG. Opponent Jamar. Sandi had 19 of 74 recorded H/outs
Rnd 15 - 99 vs Hawthorn at Aurora. Opponents McEvoy, Hale. Sandi had 45 of 102 recorded H/outs
Rnd 17 - 86 vs Richmond at MCG. Opponents Maric, Hampson. Sandi had 34 of 83 recorded H/outs
Smaller grounds - 281 of 444 H/outs - 63.3%. Larger grounds - 98 of 259 H/outs - 37.8%
When you consider the smaller ground figures include games against Goldy and Jacobs, those H/out percentage numbers are pretty damning. Don't back dinosaurs on big parks!
Sandi's draw this year looks like this:
S = Smaller, L = Larger, D = grounds around Domain's size, B = Bye

S,D,D,S,D,S,D,L,D,S,D,D,D,L,B,L,D,D,D,D,D,D,D

That post regarding Sandilands is possibly the best analysis I've seen on this website and that is saying something given all the previous posts by the SCS community!

It is not all that surprising that Sandilands scores are higher on a small ground - but to get the stats which show hitout % on smaller grounds at 63% and hitout % on larger grounds at 37% is mind boggling. Sure he is more tired, but to be almost double the hitouts!!!! I would never have imagined a % change of more than 10%.

Brilliant - and he was on my radar before now with his draw somewhat favourable (not brilliant but certainly not tough for ruckman analysis), but this puts him right a the top of my list!!
Thanks JT,
it's not just the tiring factor, but also the ability to get to the contest on the bigger grounds, with a lot more ground to cover. There's also the factor of, that bigger grounds lead to more open play, and therefore less stoppages.
 
Last edited:

Rowsus

Statistician
Joined
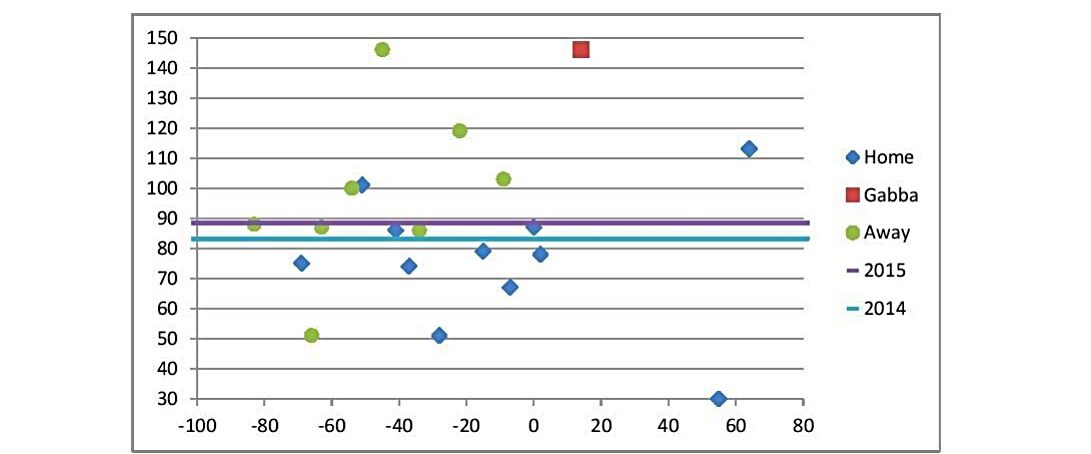
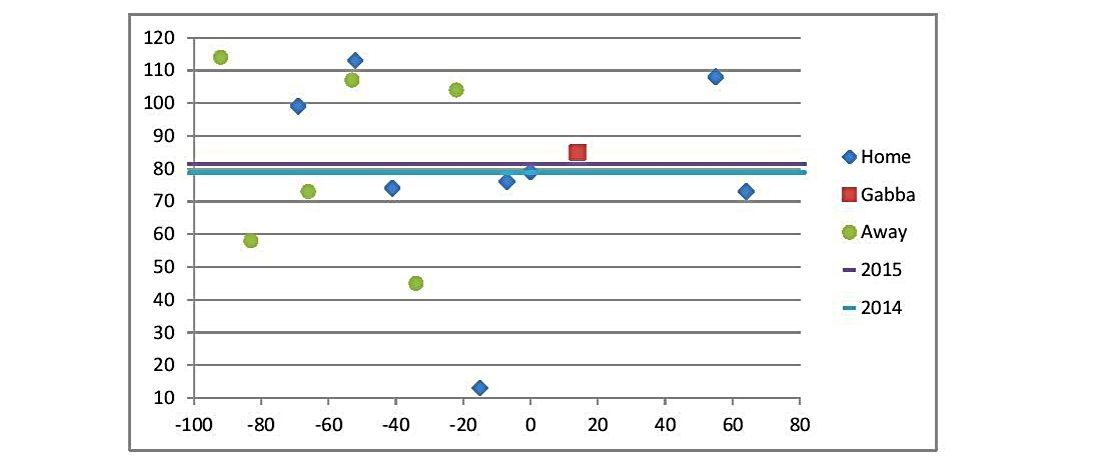
19 Mar 2012
Messages
29,137
Likes
64,907
AFL Club
Melbourne
#42
Garrick Ibbotson (FTB)


Season - 22 games at 80.4 (2014 10 games at 63.8)
Home - 12 games at 84.4 (Home wins 10 at 87.9, Home losses 2 at 67.0)
Away - 10 games at 75.6 (Away wins 7 at 88.6, Away 3 losses at 45.3)
Wins - 17 games at 88.2
Losses - 5 games at 54.0

Of note...
I was never really interested in Ibbotson in 2015, even at his discounted price. With Duffield now gone I believe Ibbotson is worth considering again. In 2015 Ibbotson averaged 89.5 in the 8 games he played without Duffield. This included his 3 best scores (132, 122 & 111). Ibbotson is a FTB, and was in 2013 and 2014 as well, though those seasons he missed a number of games, which made it hard to catagorise him as a FTB. He averaged 98 in his 6 winning games that Duffield didn't play in 2015.
 

Rowsus

Statistician
Joined
19 Mar 2012
Messages
29,137
Likes
64,907
AFL Club
Melbourne
#43
David Mundy


Season - 21 games at 113.5 (2014 22 games at 102.2)
Home - 12 games at 115.9 (Home wins 10 at 116.4, Home losses 2 at 113.5)
Away - 9 games at 110.3 (Away wins 7 at 114.3, Away 2 losses at 96.5)
Wins - 17 games at 115.5
Losses - 4 games at 105.0

Of note...
Pop quiz: Which players scored the most 100+ scores in 2015?
Answer: Goldstein, Pendelbury & Mundy with 18 each.
Mundy was the 7th rated player by average in 2015 (6th rated Midfielder), 8th rated player by total points (6th rated Midfielder), and 7th rated player in the PIT system (5th rated Midfielder). That's pretty impressive for a player that was 29 at the start of the season, with 210 games under his belt at Rnd 1, and who's best 4 seasons prior to last season were: 107, 104, 102, 94. It sort of breaks the mold, as players that old and experienced shouldn't be breaking out. The questions then become, why did this happen? And can he repeat it?
Why?
Mundy's clearances went up from 120 in 2014 (51 centre clearances) to 151 in 2015 (50 centre clearances). His DE% went up significantly from 65% to 73%. That's a huge difference! His H/outs went up from 18 to 46, though how many were to advantage I have no idea! His CP's went up from 225 to 254. All those little bits add up, and his effective disposals went up about 2/game. It's not hard to see where his improvement in his SC score came from.
Repeatable?
We can't say a definitive "no!", but it would seem a big task for him to repeat 2015's numbers. Consider this, he is 30 now, and he is coming off a season with career high numbers (in average/game) in the following stats: Disposals by 2.37, H/outs by 1.04, Clearances by 1.04, Frees for by 0.35, CP's by 1.55, Goal assists by 0.02, DE% by 1.7% SC by 6.4. It really is a big ask, and if you start with him there doesn't seem to be much potential for an upside with him.
The slow demise of Barlow with leg problems has probably aided Mundy's rise, and I can't see Barlow bouncing completely back, so that helps those keen on Mundy. History says older, more experienced players don't set new levels, but can have a spike season. At this stage, I am happy to call Mundy's 2015 a spike season, that he won't be able to match again.
Red Rooster, indeed!

Jordan Lewis says Hi!
 
Last edited:

Rowsus

Statistician
Joined
19 Mar 2012
Messages
29,137
Likes
64,907
AFL Club
Melbourne
#44
Michael Johnson


Season - 13 games at 80.8 (2014 18 games at 87.2)
Home - 8 games at 69.9 (Home wins 6 at 85.0, Home losses 2 at 24.5)
Away - 5 games at 98.2 (Away wins 4 at 92.5, Away 1 loss at 121.0)
Wins - 10 games at 88.0
Losses - 3 games at 56.7

Of note...
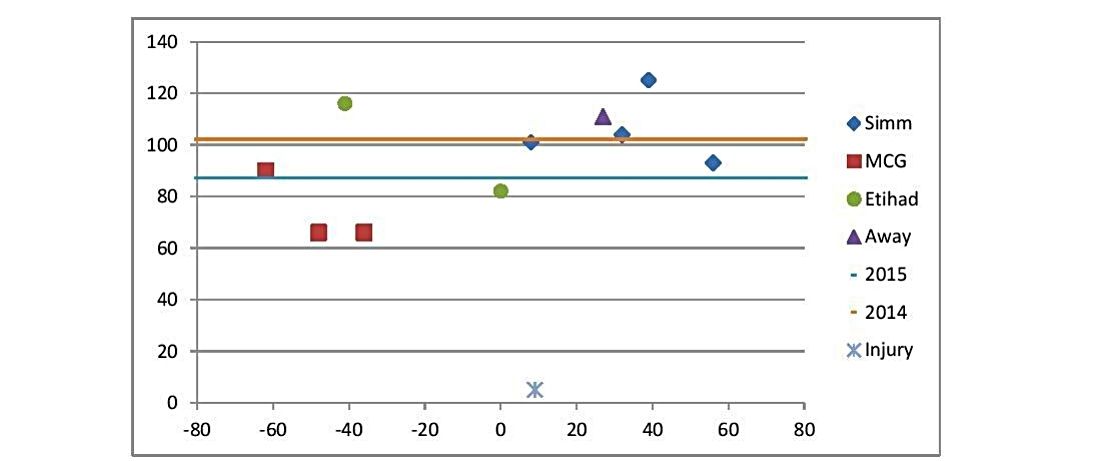
Johnson has that 12 minute, -3 score in there in 2015, and that automatically builds in a discount for 2016, unless you think there will be some sort of repeat! His break up without that game in there looks like this:
Season - 12 games at 87.8 (2014 18 games at 87.2)
Home - 7 games at 80.3 (Home wins 6 at 85.0, Home loss 1 at 52.0)
Away - 5 games at 98.2 (Away wins 4 at 92.5, Away 1 loss at 121.0)
Wins - 10 games at 88.0
Losses - 2 games at 86.5
I was hoping there would be something significant to report on MJ's figures without McPharlin in the team. In fact, there is no difference! Without the -3 game in there, MJ has played 51 games in the last 3 seasons at 87.2. Without McPharlin he has 16 games at 86.4, and with McPharlin 35 games at 87.6. That's remarkably consistent! Bottom line, MJ is 31, and coming off 2 injury interrupted seasons, and is only priced around 9% below his career level. That doesn't read as very tempting to me.

Freo's backline looked very different this year. I think if Zac Dawson and Silvagni can play full seasons, then Michael Johnson may get that intercepting/rebounding role. That's just speculation though. Ibbo is good in that role.
MJ tearing his hamstring and scoring a negative 3 or 4 before getting subbed off still haunts me, not sure I want him in my team at the moment...
A lot depends on the number of tall forwards the opposition has. Depending on injuries etc. MJ plays on the 2nd or 3rd tall Forward. If he's not required in that role, then he does seem to be the preferred intercept mark option. MJ being 195cm, and Ibbotson being 186cm, means they won't often be competing for the same role, on the same day. The retirement of McPharlin is a factor to consider for MJ as well (*edit - turns out this isn't a factor after all!).
 
Last edited:

Rowsus

Statistician
Joined
19 Mar 2012
Messages
29,137
Likes
64,907
AFL Club
Melbourne
#45
Michael Barlow


Season - 22 games at 93.6 (2014 17 games at 111.7)
Home - 12 games at 88.7 (Home wins 10 at 93.6, Home losses 2 at 64.0)
Away - 10 games at 99.6 (Away wins 7 at 91.6, Away 3 loss at 118.3)
Wins - 17 games at 92.8
Losses - 5 games at 96.6

Of note...
It's a bit hard to know what to make of Barlow's downturn. In 2011 and 2012 he averaged under 110, but both of those seasons can be put down to recovering from his broken leg. In 2010, 2013 & 2014 he averaged over 110, so where did this 94 season come from? The answer doesn't smack you in the face in his stats, or DE%. His Clearances were well down on 2014. In 2015 he had 51 Clearances in 22 H & A games. This included 8 in the Rnd 23 game, when half the regular Mids were missing, so without his Rnd 23 bonus he averaged 2 clearances/game in 2015. Using the same process on his 2014 Clearances, and leaving his Rnd 23 numbers out, he averaged around 4 Clearances/game. Now, those numbers alone don't gets us an 18/game drop in SC, but it might represent a role change, as it is proof he is not attending as many stoppages, which in turn implies his on ball time is down on previous seasons. This fits with what I saw in watching most of Fremantle's games in 2015. Also, even though he played all 22 games, I will swear Barlow was carrying a niggle for quite a few games. He has had the broken leg, foot, knee and ankle problems. Maybe his legs just aren't carrying him to the contests like they used to? I'm happy for any Freo supporters to chime with opinion here. Also, the leg problems might be indicative of his kicks lacking penetration, and he might be kicking shorter. That's something that can show up in a SC score. He was reportedly offered as trade bait, which also is another indicator of possible problems. All in all, if we had solid proof one way or another, we'd have him locked in, or locked out of our teams. It would seem the only safe thing to do, is monitor his pre-season movement, and see if he is moving freely, kicking long, and getting good on-ball rotation. If he's not, then forget him, if he is, he could be a bargain.

Was he under a fitness cloud or did he just fall down the pecking order with the emergence of Neale? I wish I knew. I believe he had back problems in 2014 but didn't hear much about that this year.
I would love to have access to the true Medical reports, and also the reason that Freo reportedly offered Barlow as trade bait. As to him slipping behind Neale, Neale was the number one in the AFL for first hands on the ball at stoppages in the last 6 or 8 games of 2014. A reasonable expectation that he was high up in stoppages attended in those games, and possibly ahead of Barlow already. Barlow played 7 of the last 8 games in 2014, and averaged 119 in those games.
 
Last edited:

Rowsus

Statistician
Joined
19 Mar 2012
Messages
29,137
Likes
64,907
AFL Club
Melbourne
#46
Stephen Hill


Season - 21 games at 95.9 (2014 18 games at 96.1)
Home - 12 games at 97.1 (Home wins 10 at 94.6, Home losses 2 at 109.5)
Away - 9 games at 94.3 (Away wins 7 at 98.6, Away 2 loss at 79.5)
Wins - 17 games at 96.2
Losses - 4 games at 94.5

Of note...
7 of Hills top 9 scores were registered at home. Only one score above 90 in the 4 losses he played in. His good scores coincided with the games in which he had his better goal and tackle counts. That may not be totally unexpected, given the value they can add to a SC score, but given he only kicked goals in half his games, and multiple goals in 4 games, it's not something you want to rely on. He was =4th with Fyfe on 17 goals for the season, but that won't be enough to get him M/F DPP, and it's hard to see him making the necessary step up to make him SC relevant.
 

Rowsus

Statistician
Joined
19 Mar 2012
Messages
29,137
Likes
64,907
AFL Club
Melbourne
#47
Harley Bennell


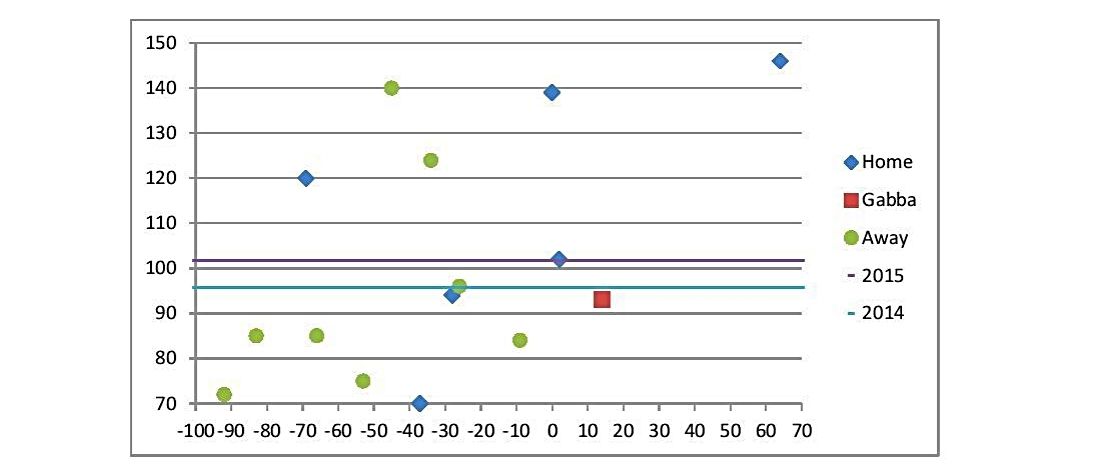
Season - 15 games at 101.7 (2014 15 games at 95.7)
Home - 6 games at 111.8 (Home wins 2 at 124.0, Home losses 4 at 105.8)
Gabba - 1 game at 93.0 (Gabba wins 1 at 93.0, Gabba losses 0 at 0.0)
Away - 8 games at 95.1 (Away wins 0 at 0.0, Away 8 losses at 95.1)
Wins - 3 games at 113.7
Losses - 12 games at 98.7

Of note...
Of interest value only, as he has changed Clubs.
Even if he hadn't changed Clubs, he would be hard to assess, as the injuries to GC's Mids in 2015 would make it impossible to define his role for the coming season. He averaged less than 80 when playing in a team that got thrashed interstate, but that shouldn't happen too often from here. Similarly, he averaged 120 in games they didn't lose, that were played in Queensland. I think he will be super keen to show his new Club that he was a good trade, but that first year eagerness usually only lasts exactly that, the first year! Watch his preseason for what role he plays, and pray he keeps his DPP!

Interesting discussion on Perth radio yesterday morning with one journo suggesting that Freo's lack of forward fire power will be o***et next year by Nat Fyfe playing more in the forward line and Bennell taking up the midfield time. Suggested that this scenario may be trialled in the pre season. Love that pre season crystal ball gazing!:p
 
Last edited:

Rowsus

Statistician
Joined
19 Mar 2012
Messages
29,137
Likes
64,907
AFL Club
Melbourne
#48
Patrick Dangerfield


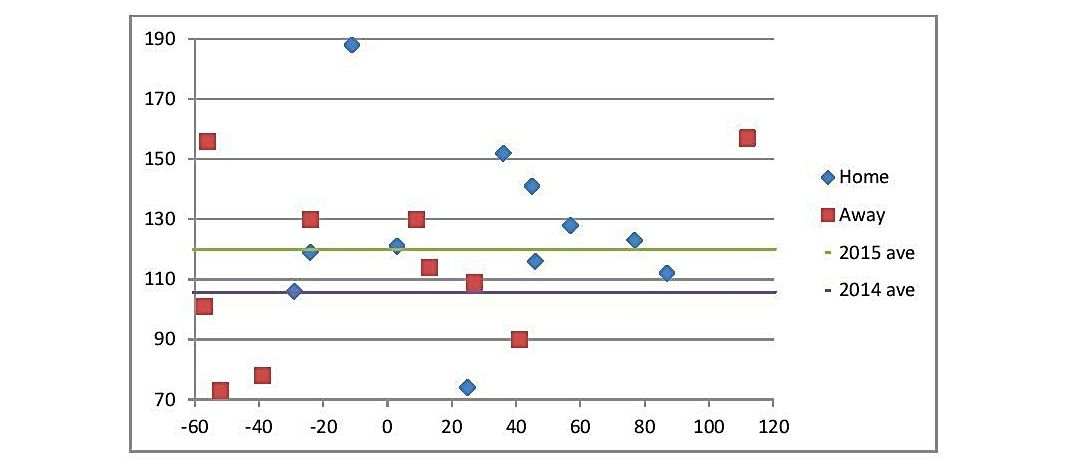
Season - 21 games at 119.9 (2014 22 games at 105.6)
Home - 11 games at 125.5 (Home wins 8 at 120.9, Home losses 3 at 137.7)
Away - 10 games at 113.8 (Away wins 5 at 120.0, Away losses 5 at 107.6)
Wins - 13 games at 120.5
Losses - 8 games at 118.9

Of note...
The fact that he has changed Clubs renders this table down to interest value only.
How do you average 119.9, when you have 4 games between 73 and 90?
You do it by being a superstar, and averaging 129.6 in your other 17 games!
Just so consistent over all the break-ups above!
 

Rowsus

Statistician
Joined
19 Mar 2012
Messages
29,137
Likes
64,907
AFL Club
Melbourne
#49
Mark Blicavs


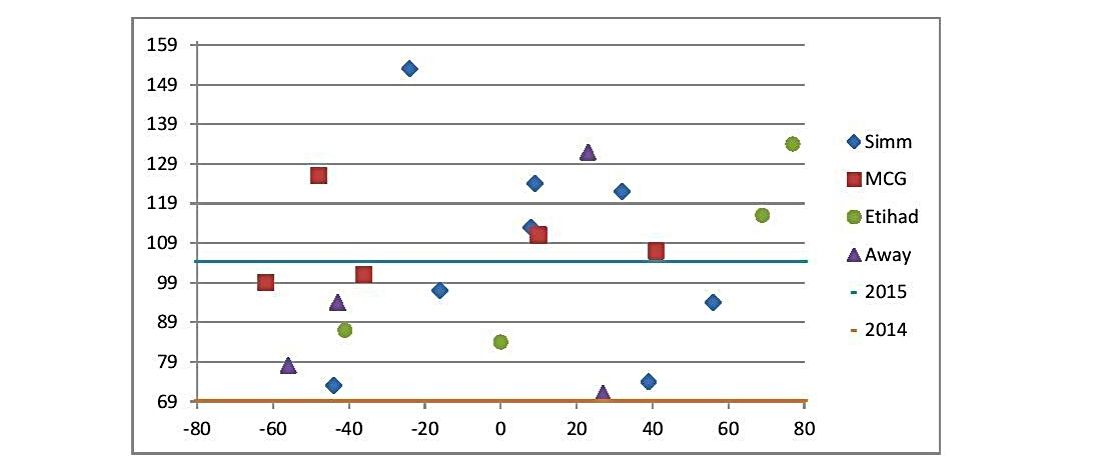
Season - 21 games at 104.3 (2014 21 games at 69.2)
Home - 8 games at 106.3 (Home wins 5 at 105.4, Home losses 3 at 107.7)
MCG - 5 games at 108.8 (MCG wins 2 at 109.0, MCG losses 3 at 108.7)
Etihad - 4 games at 105.3 (Etihad wins 2 at 125.0, Etihad losses 2 at 85.5)
Away - 4 games at 93.8 (Away wins 2 at 101.5, Away losses 2 at 86.0)
Wins - 11 games at 108.9
Losses - 10 games at 99.2

Of note...
With Zach Smith and possibly Rhys Stanley to come into the team, it would seem both statistically and circumstantially that Blicavs will suffer, SC-wise. Blicavs averaged 16.3 H/outs in 2015 after averaging 7.7 in 2014. It would seem that his increase in tackles in 2015, up from 3.3 to 6, and his increase in clearances up from 0.8 to 3.6, are a by-product of him attending more stoppages in 2015. While he will still attend some in 2016, we can probably expect it to drop enough to impact his SC score. I can't see him dropping back to 70, but I think he will fall reasonably short of the 100 mark too.
 
Last edited:

Rowsus

Statistician
Joined
19 Mar 2012
Messages
29,137
Likes
64,907
AFL Club
Melbourne
#50
Joel Selwood (FTB)


Season - 20 games at 104.8 (2014 22 games at 120.9)
Home - 7 games at 125.7 (Home wins 4 at 153.0, Home losses 3 at 89.3)
MCG - 5 games at 84.2 (MCG wins 2 at 93.5, MCG losses 3 at 78.0)
Etihad - 4 games at 99.0 (Etihad wins 2 at 106.0, Etihad losses 2 at 92.0)
Away - 4 games at 99.8 (Away wins 2 at 115.5, Away losses 2 at 84.0)
Wins - 10 games at 124.2
Losses - 10 games at 85.4

Of note...
It's a chicken and egg question. Did Geelong lose because Selwood was being curtailed, or did Selwood go backwards in SC, because Geelong were losing? The answer is probably "A little from column A, a little from column B" (thanks Abe Simpson!). You wouldn't think Selwood would be a FTB, but the disparity between his winning scores and his losing scores is just too great last year to not make him one! Averaged 121 in his last 7 games, which also included a 51 and an 81! This matches his recent penchant for good 2nd half of seasons.
2015 first 13 games 96, last 7 games 121
2014 first 15 games 114, last 7 games 135
2013 first 13 games 105, last 9 games 137
The problem is, that this season he starts the year cheaper than he has since 2008, and at a price that you can probably survive a slow start by him.
The other question is obviously, what affect does Dangerfield have? To be honest, I have no idea. My guess is they will probably split the best tag each week, which in essence would be a plus for Selwood, you would think.

I find Selwood being a FTB fascinating because I wouldn't naturally assume he is one. Looking back at your work in the preseason 13 FTB thread I observed that Selwood had a FTB rating of +12.7% so there is definitely a tendency showing through the stats. My first thought was that maybe it is a result of him beating up on some of the weaker teams at Kardinia Park, particularly with 4 wins at KP last year at 153 ave.

So I decided to have a bit of an ad hoc look at his scores over the last five to six years looking at his massive scores to see where and against whom they came. Not quite as scientific as Rowsus' work but something I like to do to get a general idea over time. While there were some great scores against weak teams at Kardinia Park, enough of them that would flow into and influence the stats to being a bit of an FTB, there was also plenty of good returns at other grounds and against quality opponents. I also had a look through his crap scores and these also seemed to come from a variety of level of opponents.

Anyway, I think Dangerfield will probably help Selwood's scores. The way I see it Selwood has had some great players around him for all most of his career and had many great season averages, so I don't buy into the idea that Danger will take away some of his points in the long haul. Selwood's worse season since his second year he had less quality around him than any other year and it was the first time the Cats missed the finals in his career. With Danger and the Cats other experienced recruits they should win a few more games this year, and with Selwood showing a FTB tendency this should see a natural lifting in his overall score for the year.

PS A bonus in looking at players ad hoc scores is you notice some little things. If one does start the season with Selwood, in Round 3 look to make Selwood your Captain option, the last four times he has played Brisbane at Kardinia he has scored 171, 176, 127 and 175.
2009 22 110.9
2010 21 117.8
2011 17 111.5
2012 20 117.6
2013 22 118.4
2014 22 120.9
2015 20 104.8

Averaging above 20 games a season, and 6 seasons above 110 make him a lock for me. Surely the Cats are due to win more games this year than next.
Would be a very brave and courageous move not to start him, Minister
Geelong have a great draw. They don't have to play any of the 6 hardest supercoach teams from last year twice.
 
Last edited:

Rowsus

Statistician
Joined
19 Mar 2012
Messages
29,137
Likes
64,907
AFL Club
Melbourne
#51
Cameron Guthrie


Season - 21 games at 97.1 (2014 22 games at 80.1)
Home - 8 games at 102.9 (Home wins 5 at 110.2, Home losses 3 at 90.7)
MCG - 5 games at 86.4 (MCG wins 2 at 65.0, MCG losses 3 at 100.7)
Etihad - 4 games at 99.0 (Etihad wins 2 at 82.5, Etihad losses 2 at 115.5)
Away - 4 games at 97.3 (Away wins 2 at 109.0, Away losses 2 at 85.5)
Wins - 11 games at 96.7
Losses - 10 games at 97.6

Of note...
Suprisingly, he appears to be a small ground player. Breaking his games up into two ground sizes we get.
Small Grounds: < 16,200m^2 14 games at 102.6
Medium and Large Grounds: > 16,200m^2 7 games 86.1
8 of his top 9 scores were recorded on Small grounds. 5 of those 8 were in wins.
The Small grounds had 8 wins and 6 losses, and M/L grounds had 3 wins and 4 losses.
He averaged 123 in the last 6 games, which is sort of interesting when you sit it along side Selwood. Selwood went from 96 in the first 13 games to 121 in the last 7 games, and Guthrie went from 87 in the first 15 games to 123 in the last 6 games. Between the two of them, they were grabbing an extra 61 SC points/game in the last 6 games. Geelong won 3, drew 1 and lost 2 of those games.
 
Last edited:

Rowsus

Statistician
Joined
19 Mar 2012
Messages
29,137
Likes
64,907
AFL Club
Melbourne
#52
Josh Caddy (FTB)


Season - 19 games at 93.7 (2014 14 games at 77.1)
Home - 7 games at 112.7 (Home wins 4 at 131.5, Home losses 3 at 87.7)
MCG - 4 games at 75.8 (MCG wins 2 at 86.5, MCG losses 2 at 65.0)
Etihad - 4 games at 78.5 (Etihad wins 2 at 104.0, Etihad losses 2 at 53.0)
Away - 4 games at 93.8 (Away wins 2 at 108.5, Away losses 2 at 79.0)
Wins - 10 games at 112.4
Losses - 9 games at 73.0

Of note...
Maybe it's a trend with Geelong's second and third string Mids, but another with good small ground numbers, and not just at Simmonds. In fact, he's a Small ground (FTB), but a still a (FTB) overall. With an over 50% better average in winning games, he just has to be.
Small ground wins 7 at 122.1, Small ground losses 6 at 71.5
M/L ground wins 3 at 89.7, M/L ground losses 3 at 76.0
Another player that it will be interesting to see how Dangerfield affects. It's enough to say he is nearly unpickable until we know.
 
Last edited:

Rowsus

Statistician
Joined
19 Mar 2012
Messages
29,137
Likes
64,907
AFL Club
Melbourne
#53
Corey Enright


Season - 21 games at 95.6 (2014 20 games at 89.0)
Home - 8 games at 95.4 (Home wins 5 at 99.8, Home losses 3 at 88.0)
MCG - 5 games at 102.2 (MCG wins 2 at 114.0, MCG losses 3 at 94.3)
Etihad - 4 games at 86.3 (Etihad wins 2 at 82.5, Etihad losses 2 at 90.0)
Away - 4 games at 97.3 (Away wins 2 at 110.5, Away losses 2 at 84.0)
Wins - 11 games at 101.2
Losses - 10 games at 89.5

Of note...
Enright has been a Def hero for many years. In 2014 he had a down year, and a lot people dropped off him , assuming age had finally caught up with him. Let's look at a snapshot of history.
2015 5th Def on total points, 7th Def on average
2014 17th Def on total points, 15th Def on average
2013 6th Def on total points, 10th Def on average
2012 7th Def on total points, 8th Def on average
2011 9th Def on total points, 8th Def on average
2010 7th Def on total points, 8th Def on average
That is remarkably consistent! He has missed 8 games in the last 10 seasons, and 2014 was his only year in that time where he fell below 90.
The question of age does raise itself though, with Enright being around 34.5 years old when the season starts in 2016. Do you want to start a near 35 year old, at his highest starting price in the last 5 seasons?
 

Rowsus

Statistician
Joined
19 Mar 2012
Messages
29,137
Likes
64,907
AFL Club
Melbourne
#54
Harry Taylor


Season - 21 games at 82.0 (2014 21 games at 83.1)
Home - 8 games at 84.9 (Home wins 5 at 83.0, Home losses 3 at 88.0)
MCG - 5 games at 76.4 (MCG wins 2 at 107.5, MCG losses 3 at 55.7)
Etihad - 4 games at 99.0 (Etihad wins 2 at 102.5, Etihad losses 2 at 93.0)
Away - 4 games at 66.5 (Away wins 2 at 64.0, Away losses 2 at 69.0)
Wins - 11 games at 88.0
Losses - 10 games at 75.5

Of note...
The biggest change to Harry's game, and possibly why he doesn't quite reach the 87 and 94 averages he hit in 2012/2013, is he isn't getting Forward and kicking goals anymore. His goal count in the last 4 seasons is: 15, 15, 2, 1. Those 13 and 14 missing goals are worth around 6 or 7/game in his average, and that's what he is missing the last 2 seasons. Given the height in Geelong's Forward line, I can't see him getting back anytime soon.
 
Last edited:

Rowsus

Statistician
Joined
19 Mar 2012
Messages
29,137
Likes
64,907
AFL Club
Melbourne
#55
Jimmy Bartel


Season - 11 games at 87.2 (2014 21 games at 102.1)
Home - 5 games at 85.6 (Home wins 5 at 85.6, Home losses 0 at 0.0)
MCG - 3 games at 74.0 (MCG wins 0 at 0.0, MCG losses 3 at 74.0)
Etihad - 2 games at 99.0 (Etihad wins 0 at 0.0, Etihad losses 2 at 99.0)
Away - 1 games at 111.0 (Away wins 1 at 111.0, Away losses 0 at 0.0)
Wins - 6 games at 89.8
Losses - 5 games at 84.0

Of note...
Bartel's injury affected score of 5 was in a home win. If we remove it, the numbers affected become:
Season - 10 games at 95.4 (2014 21 games at 102.1)
Home - 4 games at 105.8 (Home wins 4 at 105.8, Home losses 0 at 0.0)
Wins - 5 games at 106.8
Bartel started his career before SC began. In that time he has only had 3 seasons with an average below 100: 2005 - 22/96.4, 2012 - 19/98.6, 2015 11/87.2. Prior to 2015 he had only missed 11 games in total in the previous 10 seasons. It looks on the surface like he will be a bargain in 2016. He turns 32 3 weeks before Xmas, and I just worry if his game count might continue to suffer, even if it is just due to management for his age. Keeping in mind, if he plays 18 games at an average of 100, his PIT65 average drops to 93.6. From a Stepping Stone or "ride him until he drops" point of view, his numbers prior to 2015 look encouraging.
In 2014 he scored 9 x 100+ scores in his 21 games, 5 in his first 9 games.
In 2013 he scored 13 x 100+ scores in his 21 games, 8 in first 10 games, 11 in his first 14 games.
In 2012 he scored 8 x 100+ scores in his 19 games, 6 in his first 10 games.
In 2011 he scored 11 x 100+ scores in his 21 games, 6 in his first 7 games.
In 2010 he scored 12 x 100+ scores in his 21 games, 9 in his first 11 games.
 
Last edited:

Rowsus

Statistician
Joined
19 Mar 2012
Messages
29,137
Likes
64,907
AFL Club
Melbourne
#56
Kade Kolodjashnij


Season - 22 games at 89.4 (2014 18 games at 68.4)
Home - 11 games at 99.0 (Home wins 3 at 105.7, Home losses 8 at 96.5)
Gabba - 1 game at 66.0 (Gabba wins 1 at 66.0, Gabba losses 0 at 0.0)
Away - 10 games at 81.1 (Away wins 0 at 0.0, Away 10 losses at 81.1)
Wins - 4 games at 95.8
Losses - 18 games at 87.9

Of note...
Averaged 75.3 in the first 9 games for the season, and 99.1 in last the 13 games. KK averaged 20 disposals with 5 CP's in those first 9 games, and 24 disposals with 7 CP's in the last 13 games. This would seem to suggest the quality of disposals also increased with the count.

We really appreciate the effort that goes into all of this analysis. Thanks again!

He is an elite runner, has played 40 games in his first 2 seasons, and should be listed as a defender again. He will seriously be considered for a breakout contender.
KK is one to watch for sure. My main concern with him however is the impact of the return of previously injured mids to the GC team and the possible impact on his role (and this SC performance). He averaged 89 this year and will likely be priced at around $480k as a Defender in 2016. He may break out further, but he may be a risky pick at that price and has a little bit of a Brodie Smith (2015 version) feel about him for mine.
It would certainly seem to be a "theme" with all GC players coming into 2016. With so many good, injured players to come back, you would think it would nearly affect 80-90% of the non-injured players, SC-wise. It will be very hard to factor in, for any non-injured GC players you might want to choose.
 
Last edited:

Rowsus

Statistician
Joined
19 Mar 2012
Messages
29,137
Likes
64,907
AFL Club
Melbourne
#57
Nick Malceski


Season - 16 games at 71.1 (2014 22 games at 105.4)
Home - 7 games at 70.1 (Home wins 2 at 57.0, Home losses 5 at 75.4)
Gabba - 1 game at 80.0 (Gabba wins 1 at 80.0, Gabba losses 0 at 0.0)
Away - 8 games at 70.9 (Away wins 0 at 0.0, Away 8 losses at 70.9)
Wins - 3 games at 64.7
Losses - 13 games at 72.6

Of note...
Wore the green vest twice, when returning from injury, but that hardly explains his dramatic fall. In the last 10 seasons he has had 6 averages that don't cut the mustard at SC level (67, 66, 52, 68, 76, 71), 1 that was borderline (91), and 3 that were good (101, 96, 105). There seems to be a lot of Coaches pencilling him in as a good pick for 2016, from what we see of the teams picked on this site already. I don't see it myself. His good SC seasons came when he was playing in one of the best drilled and structured Defences in the League, and Malceski was able to play more like a Half Back/Wing. The GC Defence is far from that, and if he is to add some starch to their Defence he can't be getting loose and running Forward too often, which is how he found his SC gold in his good years at Sydney. He needs to stay down back, and teach them how to be a good Defender. Some will say he's a no lose pick, as he should at least gain some value. I have two thoughts on that. If he scores at the level of any of his bad SC seasons in 2016 he will only maintain his value, or even drop a little! Keep in mind he needs to average around 78 just to keep his starting value, and all 6 of his bad seasons are below that. Secondly, the backline is the last place to be picking "Stepping Stones". Basically, to be a successful Stepping Stone, they need to average close enough to a Def Keeper anyway. So there appears to be no escape clause with him. He's either a good pick or a bad pick, and given his current role, I think he will more likely be a bad pick.

Just curious as to whether you think is possible/probable that the reasons for Malceskis 4 premium seasons could be directly related to his fitness. All 4 years he played 22 games hes averaged between 90-105. Seems like on that data its not unreasonable to think that if you believe hell play 22 games he'll average between 90-105?
It's possible to raise an argument for that. Malceski's two major knee ops were pre-season 2008 and 2011. They were both LARS surgeries, that saw him back doing (knee involved) fitness work after 12-14 weeks, instead of the traditional 12 months. You might argue 2009 and 2012 were just "hangovers" from 2008 and 2011. Still, there was no hangover or major surgery to hang our hat on in 2015. I for one, am not prepared to follow the logic that 2009 and 2012 were hangovers, and 2015 was just an "off year". He certainly didn't look anything like a 90+ player in 2015, before the injury hit. I prefer to think he has to play a different role, because he just doesn't have the cattle around him at GC to allow him the freedom he had at Sydney. The alternative theory is just too risk laden, especially with a player turning 32 during the season.
 
Last edited:

Rowsus

Statistician
Joined
19 Mar 2012
Messages
29,137
Likes
64,907
AFL Club
Melbourne
#58
Thomas Lynch


Season - 20 games at 88.4 (2014 22 games at 83.2)
Home - 11 games at 76.5 (Home wins 3 at 73.7, Home losses 8 at 77.5)
Gabba - 1 game at 146.0 (Gabba wins 1 at 146.0, Gabba losses 0 at 0.0)
Away - 8 games at 97.5 (Away wins 0 at 0.0, Away 8 losses at 97.5)
Wins - 4 games at 91.8
Losses - 16 games at 87.5

Of note...
Tall players generally need to be Rucks getting H/outs or Forwards kicking at least 3 goals/game to be SC relevant (Lynch is 199cm). Lynch averaged 3.1 goals in the last 7 games of the season, and averaged 101 in those 7 games. In his first 13 games for the season he averaged 1.6 goals/game and 82 in SC. One might think the departure of Dixon might aid Lynch in his quest to average 3 goals, but I couldn't find any such correlation, in the games Lynch played, but Dixon missed. I looked at all the combinations of different GC talls to see how they affected Lynch, and have come to the conclusion there was no affect, with any combination. Some might point the finger at the games where Dixon missed or only played 24% TOG and Smith missed, and Lynch averaged 110 in those games, but it was only 2 games, so it is too small of a sample to hang your hat on. If you think the good players returning from injury can give Lynch enough supply to average 3 goals, he's a good pick. If you think he might struggle to achieve 3 goals/game, then leave him alone! Most people under-estimate how hard it is to average 3 goals/game. In 2015 only JJK managed it. In 2014 Roughead, Buddy and JJK did it. In 2013 Cloke did it. In 2012 Buddy, Tex and Pav did it, and in 2011 Buddy did it. As you can see, it may not be as easy as it looks!
 

Rowsus

Statistician
Joined
19 Mar 2012
Messages
29,137
Likes
64,907
AFL Club
Melbourne
#59
Tom Nicholls


Season - 15 games at 81.4 (2014 6 games at 78.7)
Home - 8 games at 79.4 (Home wins 2 at 90.5, Home losses 6 at 75.7)
Gabba - 1 game at 85.0 (Gabba wins 1 at 85.0, Gabba losses 0 at 0.0)
Away - 6 games at 83.5 (Away wins 0 at 0.0, Away 6 losses at 83.5)
Wins - 3 games at 88.7
Losses - 12 games at 79.6

Of note...
Let's look at his top 6 scores:
114 - vs WC (92 point loss), rucked with Z Smith (63% TOG, 11 H/outs for Smith), against NicNat and Sinclair
113 - vs Syd (52 point loss), rucked with Brooksby (86% TOG, 6 H/outs for Brooksby), against Pyke and Tippett
108 - vs Nth (55 point win), rucked with Brooksby (62% TOG, 12 H/outs for Brooksby), against Goldstein (62 H/outs for Goldy)
107 - vs Haw (53 point loss), rucked with Brooksby (88% TOG, 12 H/outs for Brooksby), against Ceglar and Hale
104 - vs WBull (22 point loss), rucked alone, against Minson
99 - vs Coll (69 point loss), rucked mainly alone but Dixon helped, against Grundy and Witts.
To me that is very promising. You might have expected his best scores to be against St Kilda, Carlton and Geelong, as those sides gave up good scores to Rucks in 2015. Sydney and Hawthorn, while they don't have quality Ruck stock, rarely gave up good scores to opposition Rucks.
So what went wrong in the other games? Let's start with his worst scores, and work our way up.
13 - vs GWS (15 point loss), only played 15% TOG and missed the next match.
45 - vs Carl (34 point loss), rucked alone against Kreuzer/Wood. He had 14 Disposals and 21 H/outs, so I am guessing lots of ineffectives in both!
58 - vs Rich (83 point loss), rucked alone, had season ending injury and only played 42% TOG
73 - vs GWS (66 point loss), rnd 4 but his first game for season, rucked with Smith against Mumford
73 - vs Bris (64 point win), his 2nd game for the season, rucked alone against S Martin
74 - vs Ade (41 point loss), rucked with Smith (59% TOG and 10 H/outs for Smith) against Jacobs
76 - vs Fre (7 point loss), rucked alone against Sandi, who got 70 H/outs. Not many Rucks scored big against Freo in 2015!
79 - vs WC (drawn game), rucked largely alone (Dixon helped) against NicNat and Sinclair
85 - vs Bris (14 point win), rucked alone against S Martin.
All in all, I think they are pretty promising numbers for a 30 game Ruck! Combine that with the trading of Smith and Gorringe, and you could see it at as they have great confidence in Nicholls. I'm not convinced as some here are, that Currie will play a lot of games. I think he was gotten to be 3rd man in line, behind Brooksby. If Nicholls can get over his tendency to get injured, I can see him largely rucking alone, with Brooksby getting a bit of "experience work" now and then.

Hi Rowsus, not sure if this is the place but here goes. Pre 2011 only 4 ruckman had scored over 100 PIT75 in a season, and never had 2 ruckman scored over 100 in the same season. Since 2011, it has been boom times with about 3 ruckman per season scoring above 100 PIT75 (and usually 1 or 2 per season above 110). The sub rule was introduced in 2011, which practically wiped out the 2nd ruck position at most clubs. Do you see the reintroduction of the sub rule having any great effect on ruck scores, or is it more to do with increased stoppages. Thanks
Not only the sub rule, but the reduced interchange cap. I think we will just see ruckmen resting forward and forwards pinch hitting in the ruck. I highly doubt we will return to two dedicated ruckmen with how aerobic the game has become with zone defences etc. That's not just rucks, that's all positions. I said it in another thread, but guys like Matt Taberner who copped the red vest 8 times last year would be extremely nervous. If you are a one dimensional big man you are going to struggle to get games.

I think it is also due in part to the change in the styles of ruckmen. If you look at some of the premier ruckmen today in Goldstein, Mumford, Nic Nat, Stef Martin - they are all ruckmen come midfielders. When Dean Cox was running around the ruck / midfield role wasn't the norm.

So, just my 2 cents but I don't think it will ruin the ruck scores at all. I think the guys I mentioned will still dominate because they are the kind of guys who already ruck entire games on their own and don't spend a lot of time on the pine.
Mumford, Goldstein, Jacobs, Martin, Blicavs, Maric and Gawn already have TOG% of greater than 85% in 2015.

The sub rule binning isn't going to effect them in the slightest.
I'm not suggesting that the TOG% will go down, if anything I think it will increase, but I think that'll be due to resting forward and I feel like most ruckman will spend less time in the ruck. Goldstein became North's clear number 1 in 2011, when the rule changed, and was able to ruck and then head to the bench. I think we'll see less bench time, but also less ruck time to compensate.

Anyway, it's just an opinion at this stage. I will wait and see how it pans out.
Unless they have to share their time with another ruckman now there are 4 interchange. West Coast and Hawthorn play 2 ruckman who have 76%-82% time on ground.
For teams that play two rucks, you are probably right.

But I don't think any of the above (expect Maric who is probably on his last legs anyway) will rest forward because they are lone wolf ruckman and usually rubbish forwards anyway.
I think there has been something like a "definition" change in the Rucks stats, that has affected their scoring. I'm not just talking about last seasons H2A change, either. I think in the not too distant past, a lot of Ruck contests had no hitouts recorded against them, but now it is rare for no hitout to be recorded. look at the numbers over the last 6 years:
Number of Hitouts recorded by the top 3 Rucks
2010 - 732, 643, 579 - 5 with 500+
2011 - 741, 724, 716 - 7 with 500+
2012 - 743, 667, 663 - 10 with 500+
2013 - 860, 822, 622 - 9 with 500+
2014 - 890, 838, 763 - 10 with 500+
2015 - 1058, 998, 859 - 9 with 500+
A definite upward trend, and not a small one. Look at the how it looks back in 2005
2005 - 595, 556, 532 - 3 with 500+
and just to hammer it home further
1995 - 354, 322, 319 - 4 with 300+

Whilst I believe this is all very possible is it also possible that the game has gone from a more free flowing contest to stoppage after stoppage? This leading to greater hitout figures? It's something that I have noticed from watching old replay games.
 
Last edited:

Rowsus

Statistician
Joined
19 Mar 2012
Messages
29,137
Likes
64,907
AFL Club
Melbourne
#60
Aaron Hall


Season - 15 games at 79.3 (2014 16 games at 59.2)
Home - 7 games at 76.9 (Home wins 2 at 118.5, Home losses 5 at 60.2)
Gabba - 1 game at 150.0 (Gabba wins 1 at 150.0, Gabba losses 0 at 0.0)
Away - 7 games at 71.7 (Away wins 0 at 0.0, Away 7 losses at 71.7)
Wins - 3 games at 129.0
Losses - 12 games at 66.9

Of note...
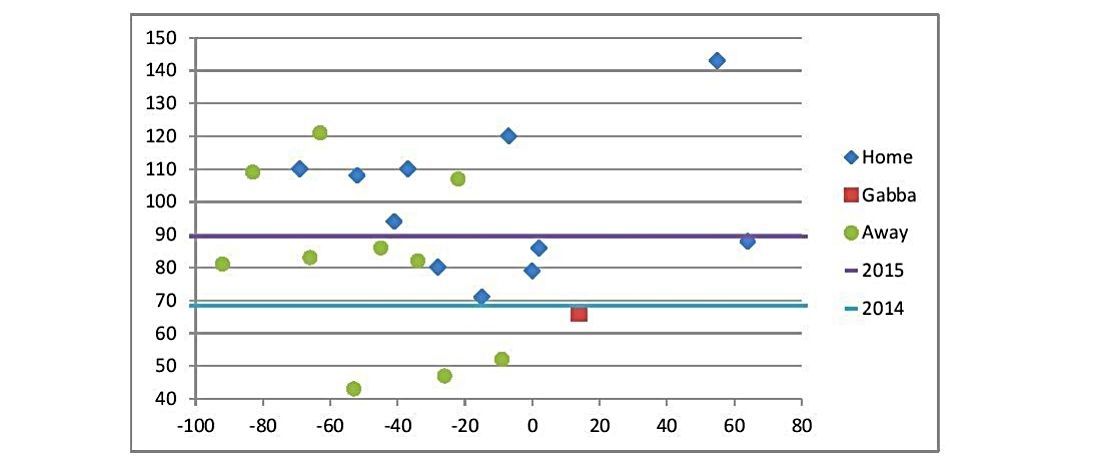
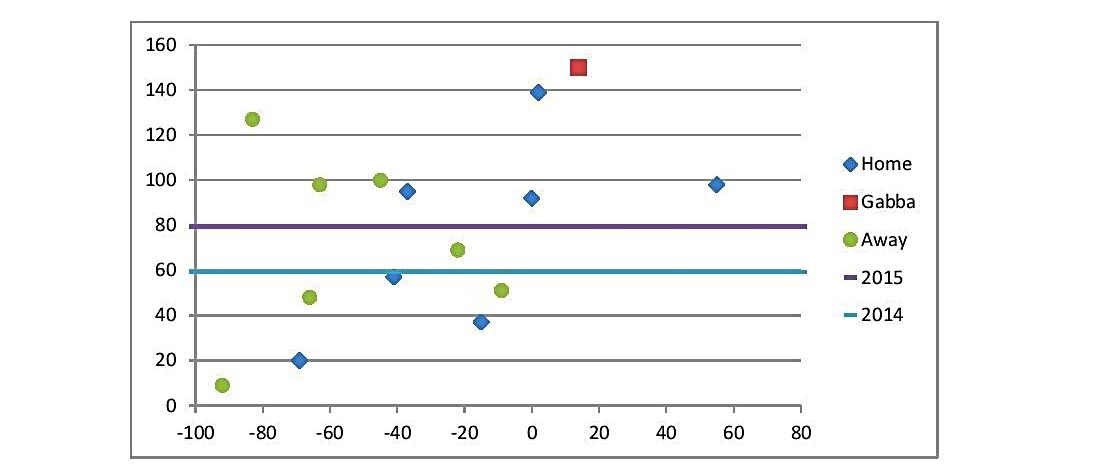
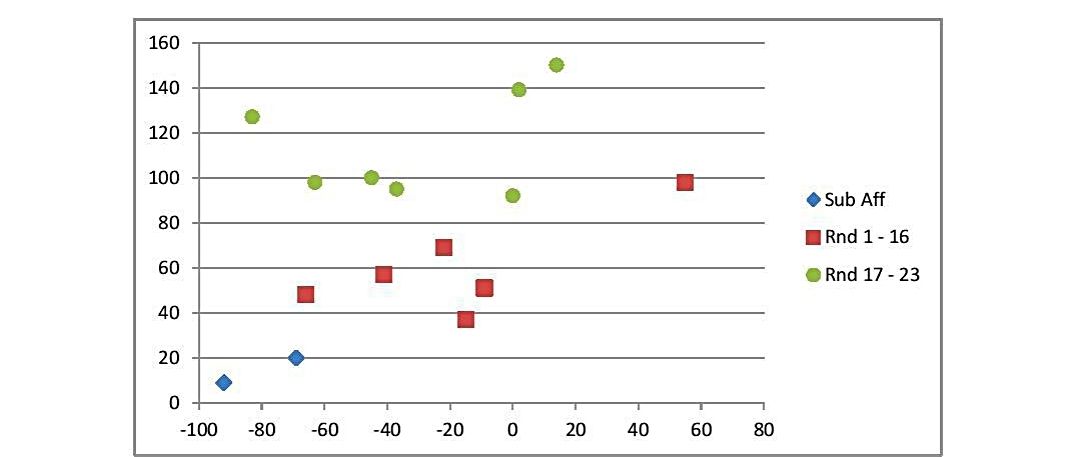
Hall had 2 sub affected games early in the season, for scores of 9 and 20. The 20 was in a game where his TOG% was 50% though! If we remove those games, his analysis becomes:
Season - 13 games at 89.3 (2014 16 games at 59.2)
Home - 6 games at 86.3 (Home wins 2 at 118.5, Home losses 4 at 70.3)
Gabba - 1 game at 150.0 (Gabba wins 1 at 150.0, Gabba losses 0 at 0.0)
Away - 6 games at 82.2 (Away wins 0 at 0.0, Away 6 losses at 82.2)
Wins - 3 games at 129.0
Losses - 10 games at 77.4
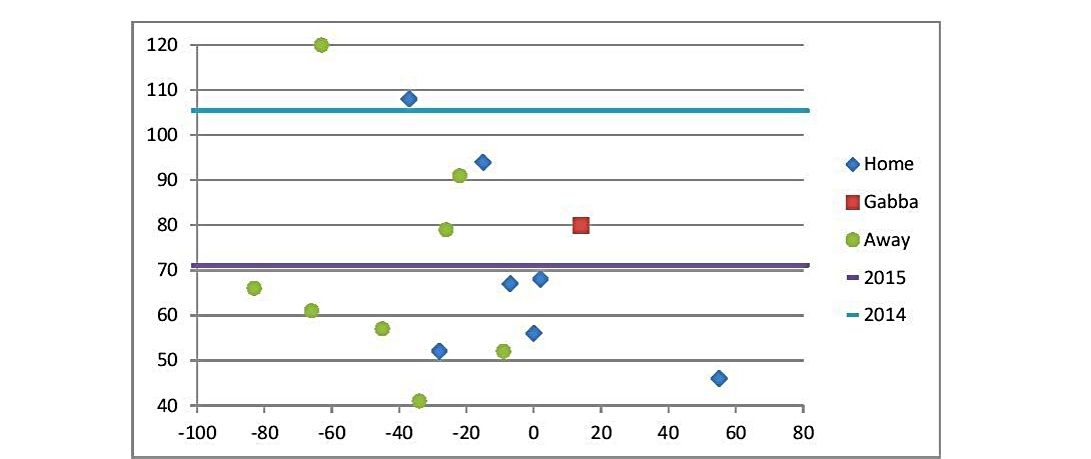
He went nuts in the last 7 games of the season and averaged 114 in those 7 games. He was only averaging 60 in 6 non-sub-affected games before then. Let's look at his chart broken up into two sections by Rounds.


Of course, the biggest problem is, the players that were missing from those 7 games. Ablett, Prestia, Swallow and Hallahan all missed all 7 games, and Bennell and Rischitelli missed one here and there. Throw in O'Meara as well, and you have to wonder how much of a run Hall will get in the Midfield next season. Benell is gone of course, but it's hard to see Hall being a 105+ player in 2016, unless the injury curse hits GC again. He potentially offers some Stepping Stone value, for those into those sort of selections.
The huge difference between Hall's average in winning and losing games would normally qualify him for (FTB) status. but because the sample is so small, and skewed by injured players missing, I'm not willing to give him that label.
 
Last edited:
Top