Opinion Rowsus Tables And Analysis Of 2015 Season

Rowsus

Statistician
Joined
19 Mar 2012
Messages
29,137
Likes
64,904
AFL Club
Melbourne
#81
Max Gawn


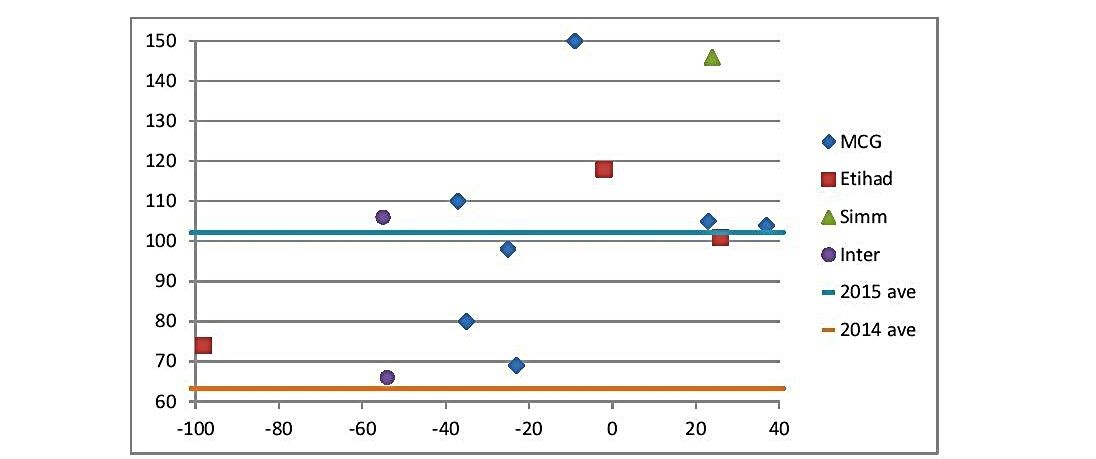
Season - 13 games at 102.1 (2014 9 games at 63.2)
MCG - 7 games at 102.3 (MCG wins 2 at 104.5, MCG losses 5 at 101.4)
Etihad - 3 games at 97.7 (Etihad wins 1 at 101.0, Etihad losses 2 at 96.0)
Simonds - 1 games at 146.0 (Simonds wins at 146.0, Simonds 0 losses at 0.0)
Interstate - 2 games at 86.0 (Interstate wins 0 at 0.0, Interstate losses 2 at 86.0)
Wins - 4 games at 114.0
Losses - 9 games at 96.8

Of note...
His big scores were when he could beat up on lesser Rucks. 150 against Essendon, McKernan Rucked solo, and lost the Hitouts to Gawn 58 to 20. 146 against Geelong, Blicavs and Walker managed 39 Hitouts between them to Gawns 44. 118 and 110 against St Kilda beating Longer both times, 39 to 35 and 32 to 17. Without the 150 in there, where he beat up on McKernan, his average on Large grounds was only 90, and his average on small and medium grounds was 109. He's probably priced up to his potential, especially as Melbourne has 10 of it's first 12 games on larger grounds.
 
Last edited:

Rowsus

Statistician
Joined
19 Mar 2012
Messages
29,137
Likes
64,904
AFL Club
Melbourne
#82
Todd Goldstein


Season - 21 games at 128.8 (2014 21 games at 106.9)
MCG - 2 games at 144.5 (MCG wins 1 at 155.0, MCG losses 1 at 134.0)
Etihad - 10 games at 133.8 (Etihad wins 6 at 149.7, Etihad losses 4 at 110.0)
Simonds - 1 games at 154.0 (Simonds wins 1 at 154.0, Simonds losses 0 at 0.0)
Blundstone - 3 games at 116.7 (Blundstone wins 3 at 116.7, Blundstone losses 0 at 0.0)
Interstate - 5 games at 114.8 (Interstate wins 2 at 140.5, Interstate losses 3 at 97.7)
Wins - 13 games at 141.4
Losses - 8 games at 108.4

Of note...
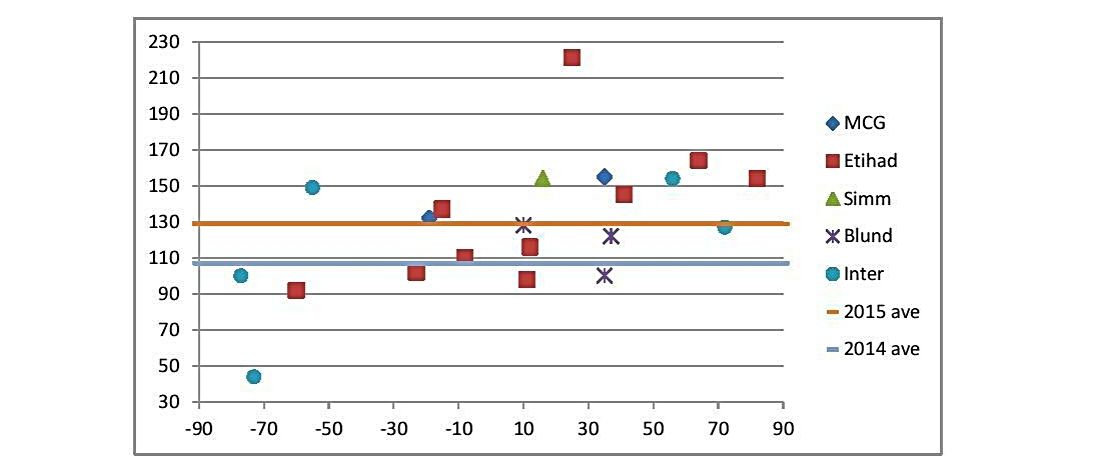
It's rather a remarkable table, isn't it? 10 x 130+ scores! He averaged 137 in Victoria (151 in 8 wins, and 115 in 5 losses), and he averaged 116 outside of Victoria (126 in 5 wins, and 98 in 3 losses). I think it is absolute folly to hope he can go close to a 130 average again in 2016. There are just so many history factors against him doing it. So the question becomes, what do you think he will average? And is he worth paying top dollar for if he averages that? Even if he averages 115, you need to weigh up a potential saved trade, against the points you gained over having him in front of another Ruck, and then toss in the around $130k you saved by bringing Goldy in later. It's a tough equation to work out! Goldstein plays 3 of his first 5 games Interstate: Rnd 2 Brisbane at the Gabba, Rnd 3 Melbourne at Blundstone, Gold Coast at Metricon. Their other 6 games in the first 9 are all at Etihad. Then from Rounds 10 to 16 they play 4 Interstate, and 2 at Etihad. So in their first 15 games it 7 Interstate, and 8 at Etihad!
For those interested in the numbers:
Small grounds 12 at 132.7 (150 in 7 wins, 108 in 5 losses)
Medium grounds 4 at 118.5 (140 in 2 wins, 97 in 2 losses)
Large grounds 5 at 127.8 (126 in 4 wins, 134 in 1 loss)
Their Draw is: SMLSMSSSSSLSSS[bye]MSSSSLLS
Interstate games

So what is this history I am talking about?
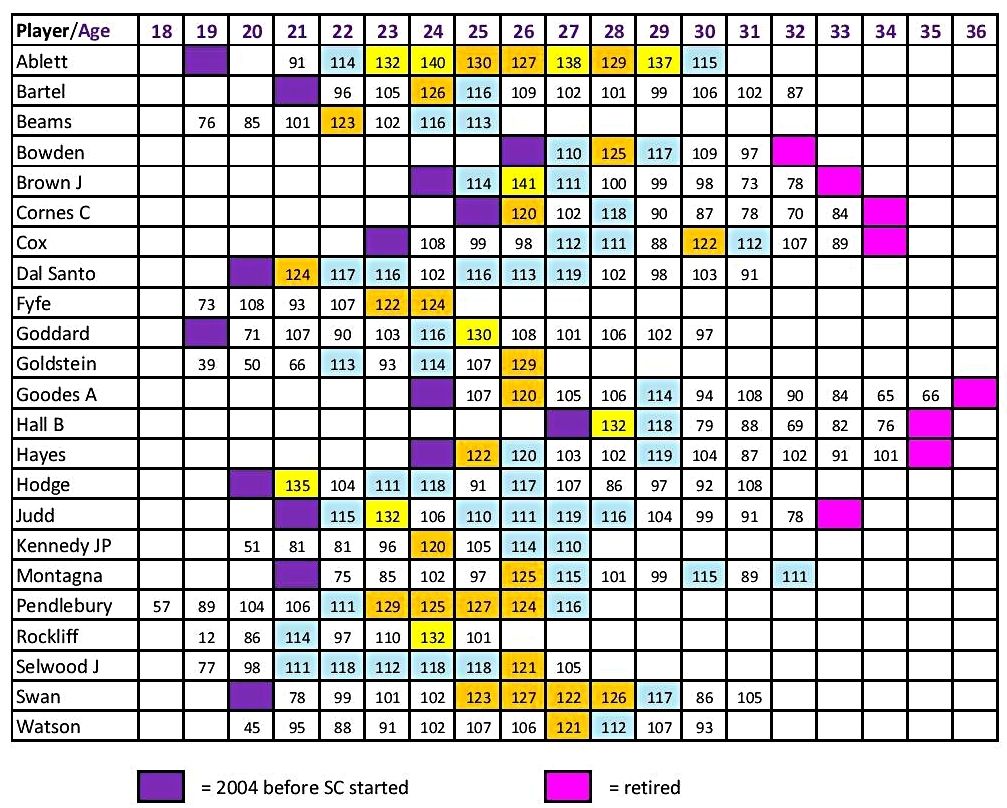
Here is a table of every player to ever average 120+ in a season in SC.
The table is sorted alphabetically, and shows what age they were when the season started.


In this table of 23 players, we can see only 4 players have recorded more than one 120+ season: Ablett (7), Swan (4), Pendlebury (4), Fyfe (2). Straight away we can see, that if Goldy is to go 120+ again, ever, he is joining pretty elite company. If you look at how these players have faired since they recorded their first 120+ season, they have played between them a further 120 seasons. Those 120 seasons average out at 104. In those 120 seasons there are:
13 seasons that were 120+ (the 4 players listed above)
32 seasons that were between 110 and 120
36 seasons that were between 100 and 110
39 seasons that were below 100
The 21 players that have recorded a 120+ season then recorded a season below 120 have averaged a drop of 16/game.
Looking at all 34 seasons where a player has averaged 120+, then played a subsequent season, the average drop is just under 10/game.
Bottom line, 120+, there are 19 one timers, and 4 multiples, and the multiples are the elite of the elite Midfielders.

Since 2007, how has the number 1 Ruck fared the following season?
2007 Cox 99 - top Ruck again 112
2008 Cox 112 - top average 111, but 13th in aggregate (11 games)
2009 Cox (ave) 111, Clark (agg) 2063 - Cox 4th ave 88, Clark 13th agg 1384 (19 games)
2010 Sandilands 114 - 4th ave 111, 16th agg 1440 (13 games)
2011 Cox 122 - 4th ave 112, 1st agg 2470
2012 NicNat (ave) 114, Cox (agg) 2470 - NicNat 8th ave 96, Cox 3rd agg 2351
2013 Minson 114 - 9th ave 93, 6th agg 1959
2014 Jacobs 115 - 4th ave 107, 2nd agg 2267

It is possible that Goldy is about to embark on a Cox like domination of the Rucking tables, but even if he does, history suggests it is more likely to be a 115 ave, than a 120+ that will get him there. We can see from that list, not too many number one Rucks back it up from season to season.
 
Last edited:

Rowsus

Statistician
Joined
19 Mar 2012
Messages
29,137
Likes
64,904
AFL Club
Melbourne
#83
Andrew Swallow


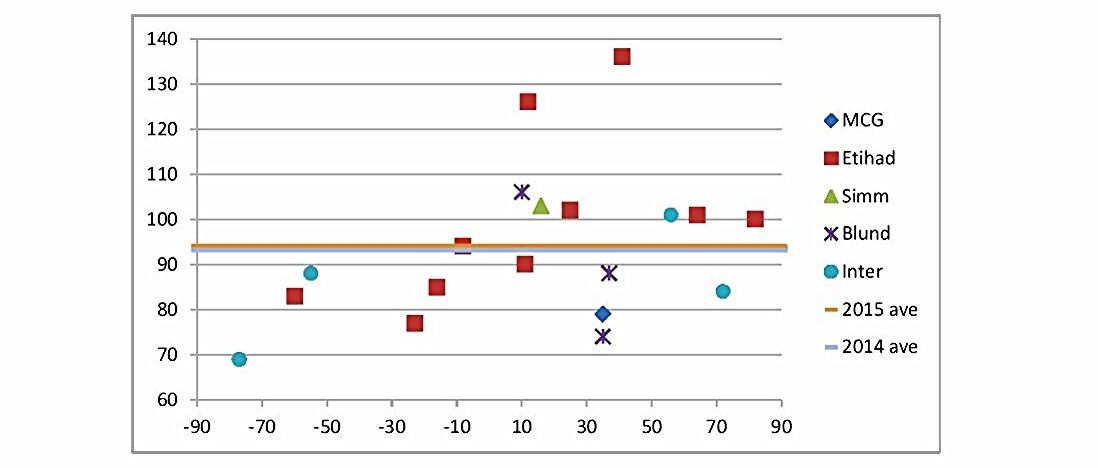
Season - 19 games at 94.0 (2014 15 games at 93.1)
MCG - 1 games at 79.0 (MCG wins 1 at 79.0, MCG losses 0 at 0.0)
Etihad - 10 games at 99.4 (Etihad wins 6 at 109.2, Etihad losses 4 at 84.8)
Simonds - 1 games at 103.0 (Simonds wins 1 at 103.0, Simonds losses 0 at 0.0)
Blundstone - 3 games at 89.3 (Blundstone wins 3 at 89.3, Blundstone losses 0 at 0.0)
Interstate - 4 games at 85.5 (Interstate wins 2 at 92.5, Interstate losses 2 at 78.5)
Wins - 13 games at 99.2
Losses - 6 games at 82.7

Of note...
A lot of us have been waiting for A Swallow to return to his 2011 (111.9)/2012 (109.4) form, after he ruptured his achilles in July 2013. I think he's had long enough, and I for one am prepared to say he is unlikely to climb the 110+ SC mountain again. He averaged 98 in Victoria, and 105 in wins in Victoria in 2015. Of course, that is countered by averaging 87 interstate, and 79 in interstate losses. Only 14 x 100+ scores in his 34 games since his return from injury tells enough of the story, I think.
 
Last edited:

Rowsus

Statistician
Joined
19 Mar 2012
Messages
29,137
Likes
64,904
AFL Club
Melbourne
#84
Brent Harvey (FTB)


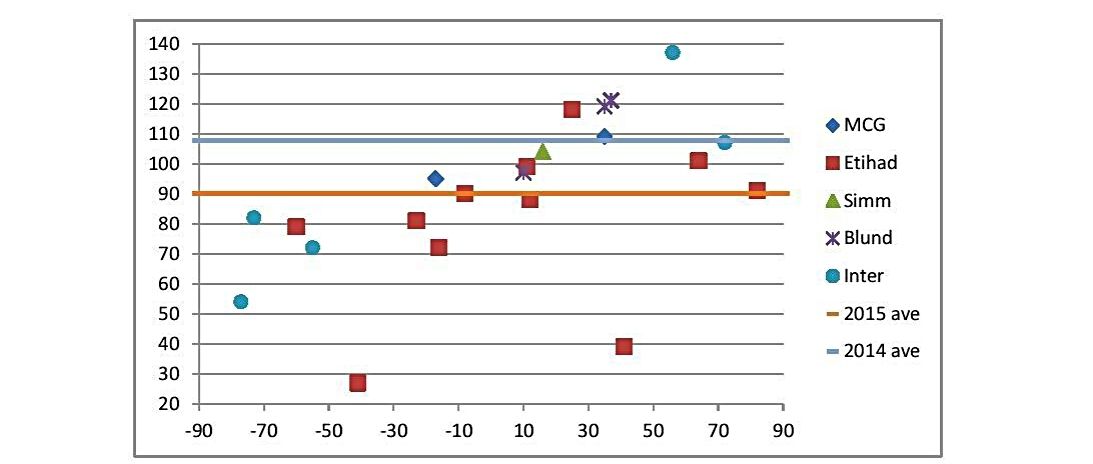
Season - 22 games at 90.1 (2014 20 games at 107.7)
MCG - 2 games at 102.0 (MCG wins 1 at 109.0, MCG losses 1 at 95.0)
Etihad - 11 games at 80.5 (Etihad wins 6 at 89.3, Etihad losses 5 at 69.8)
Simonds - 1 games at 104.0 (Simonds wins 1 at 104.0, Simonds losses 0 at 0.0)
Blundstone - 3 games at 112.3 (Blundstone wins 3 at 112.3, Blundstone losses 0 at 0.0)
Interstate - 5 games at 90.4 (Interstate wins 2 at 122.0, Interstate losses 3 at 69.3)
Wins - 13 games at 102.3
Losses - 9 games at 72.4

Of note...
Harvey was green vested twice in 2015: Rnd 15 - 39, 36% TOG and Rnd 23 - 27, 39% TOG. When he wasn't vested he averaged close enough to 90% TOG, and close enough to 96 in SC. He also scored significantly higher in winning games than losing games in 2015, enough to call him a FTB. So there appears to be two scenarios with Boomer coming into 2016.
Scenario 1 - he is at the lowest opening price he has ever been in SC. He came in to 2010 with a 2009 average of 87.7, but opened at $499,300 in 2010. He has a built in discount with those 2 subbed games, which obviously can't be repeated in 2016. He has averaged 100+ in 8 of the 11 years SC has been running, so all in all, he's a great pick, and we'd all be crazy to overlook him.
Scenario 2 - those vested games were a warning. Boomer is likely to get rested during the season, or get managed game time, and have some games where his TOG% will be significantly below his recent near 90% average. Those things will combine to throw in 2 or 3 lower scores, and 2 or 3 games where you'll need to use a bench player to cover him. Add in the fact that North have a tougher draw this season, and might win fewer games in 2016. All in all, it makes him too risky.
It's also interesting to note his ground size break up:
Small grounds - 13/80.2 (11/88.8 w/out 2 subbed games) (wins - 7/91.4, losses 6/67.2 (4/80.5 w/out sub games))
Medium grounds - 4/99.5 (2/122.0, losses 2/77.0)
Large grounds - 5/108.2 (wins 4/111.5, losses 1/95.0)
Medium and Large grounds combined 9/104.3 (wins 6/115.0, losses 3/83.0)
Nth Draw in 2016: SMLSMSSSSSLSSS[bye]MSSSSLLS - Interstate games

In my opinion it is easily scenario one. Will break the games played record come round 19 so there won't be many games where he is given a weeks spell. One of the first picked for me this year
He still might be given games with 50-60% TOG, as mini rests. That type of thing wasn't unheard of, before we had vests.

I don't want to be hearing any of that Row! As a north fan I would hate to see one of our greatest players finish off that way. Hence why he is slotted in at f3
 
Last edited:

Rowsus

Statistician
Joined
19 Mar 2012
Messages
29,137
Likes
64,904
AFL Club
Melbourne
#85
Drew Petrie


Season - 21 games at 85.5 (2014 22 games at 78.9)
MCG - 2 games at 88.0 (MCG wins 1 at 77.0, MCG losses 1 at 99.0)
Etihad - 10 games at 77.4 (Etihad wins 5 at 86.0, Etihad losses 5 at 68.8)
Simonds - 1 games at 53.0 (Simonds wins 1 at 53.0, Simonds losses 0 at 0.0)
Blundstone - 3 games at 125.0 (Blundstone wins 3 at 125.0, Blundstone losses 0 at 0.0)
Interstate - 5 games at 83.6 (Interstate wins 2 at 113.5, Interstate losses 3 at 63.7)
Wins - 12 games at 96.8
Losses - 9 games at 70.4

Of note...
Petrie had 2 paths to good scores in 2015. His traditional taking marks and kicking goals, then in a number of games he became a loose tall in Defence, taking intercept marks late in the game. SC gold in close matches! There are two interesting things with Petries good scores, and one actually compliments the other, when you think about it. He scored better when playing with both Brown and Waite playing in the team (averaged 65 in the 5 games that one of Waite/Brown missed, and 92 when all 3 played together). He also, unusually for a big man, averaged higher on medium/large grounds (averaged 106 on those grounds, and 113 in 6 wins on those grounds). The two probably fit together, as the larger grounds gave more room for all 3 to operate, where as the smaller grounds saw them choked into a tighter space. As North only have 7 games on M/L grounds in 2016, it makes Petrie too big of a risk to take in 2016.
 
Last edited:

Rowsus

Statistician
Joined
19 Mar 2012
Messages
29,137
Likes
64,904
AFL Club
Melbourne
#86
Nick Dal Santo


Season - 12 games at 92.1 (2014 22 games at 102.9)
MCG - 1 games at 90.0 (MCG wins 1 at 90.0, MCG losses 0 at 0.0)
Etihad - 6 games at 91.2 (Etihad wins 5 at 96.2, Etihad losses 1 at 66.0)
Simonds - 0 games at 0.0 (Simonds wins 0 at 0.0, Simonds losses 0 at 0.0)
Blundstone - 1 games at 78.0 (Blundstone wins 1 at 78.0, Blundstone losses 0 at 0.0)
Interstate - 4 games at 94.3 (Interstate wins 2 at 100.5, Interstate losses 2 at 88.0)
Wins - 9 games at 94.4
Losses - 3 games at 80.7

Of note...
Definitely past his prime, and would be of huge interest in a lesser position, but he's stuck as Mid only, so he's probably only of interest as a depth player in Draft Leagues. What a SC record though!
Season averages of 124, 117, 116, 102, 116, 113, 119, 102, 98, 103, 91
Add into that, that he only missed 3 H & A games between 2005 and 2014!

Take a moment to appreciate this little gem......

Dal Santo has scored a career 25,258 SC points at 109.8 (from 230 H & A games only)

That is the highest of any player........ ever!

Ablett has around 24,720* (205 at 120.6) and Swan is in 3rd place with 24,150 (221 at 109.3), more than 1,000 behind Dal Santo!!!

Here's a thing to do. Find a friend who thinks he's a sports-wiz (and doesn't visit this site), and bet him a slab he can't name the player that has scored the most points in SC history!

*Ablett's 2005 figures approximated at 22 games at 80/game, as no one anywhere seems to have a clue what he averaged in 2005!!!
 
Last edited:

Rowsus

Statistician
Joined
19 Mar 2012
Messages
29,137
Likes
64,904
AFL Club
Melbourne
#87
Jamie MacMillan


Season - 14 games at 88.7 (2014 4 games at 63.0)
MCG - 1 games at 92.0 (MCG wins 0 at 0.0, MCG losses 1 at 92.0)
Etihad - 8 games at 80.9 (Etihad wins 4 at 69.8, Etihad losses 4 at 92.0)
Simonds - 0 games at 0.0 (Simonds wins 0 at 0.0, Simonds losses 0 at 0.0)
Blundstone - 1 games at 92.0 (Blundstone wins 1 at 92.0, Blundstone losses 0 at 0.0)
Interstate - 4 games at 102.8 (Interstate wins 1 at 140.0, Interstate losses 3 at 90.3)
Wins - 6 games at 85.2
Losses - 8 games at 91.4

Of note...
There were quite a few here keen on Macmillan in 2015, due to his preceived discount. If he can show his legs are ok coming into 2016 (he has missed games with lower leg and hamstring injuries), then I am quite bullish about him! I used a similar logic to be bullish about Hannebery in 2015, and that proved to be fairly right. Let's color code MacMillan's 2015, as a simple visual exercise to show my thinking. I will include his final series (/) as well.
X = didn't play

71, X, X, X, 81, X, 51, 92, 92, 92, 72, 140, Bye, 108, 101, 59, X, X, X, X, 68, 94, 121 / 107, 94, 68

So to be a little loose, let's call the dark blue scores as games when he was match fit, and able to play in consecutive weeks. That's 13 games at 95.4. It has his injury affected 59 in Round 16 in there, as well. Given he is 24, has played only 81 games and missed nearly all of 2014, which would have been a crucial development 5th season, with 57 games under his belt, I believe he can make progress this season. But only if his legs are ok!
 
Last edited:

Rowsus

Statistician
Joined
19 Mar 2012
Messages
29,137
Likes
64,904
AFL Club
Melbourne
#88
Shaun Higgins


Season - 21 games at 95.3 (2014 20 games at 76.4)
MCG - 2 games at 113.5 (MCG wins 1 at 145.0, MCG losses 1 at 82.0)
Etihad - 10 games at 93.5 (Etihad wins 6 at 98.7, Etihad losses 4 at 85.8)
Simonds - 1 games at 0.0 (Simonds wins 1 at 82.0, Simonds losses 0 at 0.0)
Blundstone - 3 games at 99.7 (Blundstone wins 3 at 99.7, Blundstone losses 0 at 0.0)
Interstate - 5 games at 91.8 (Interstate wins 2 at 85.0, Interstate losses 3 at 96.3)
Wins - 13 games at 99.1
Losses - 8 games at 89.3

Of note...
Higgins was available as a D/M in 2015, in 2016 he is Forward only. When a player changes Clubs, he doesn't suddenly become a better, or different player, but sometimes he can play a different role. This applies in spades to "established" players, that have over 100-120 games under their belts before they change Clubs. Quite often a player that changes Clubs can have a good year in the first year at the new Club, but that can lead to a return to normal outptut in following a subsequent years. I have a feeling we are looking at something like that with Higgins. Looking at his 4 highest SC seasons: 2015 21/95, 2009 17/89, 2012 19/80, 2010 16/78. When you realise he is coming into his 11th season, those numbers don't read to well, especially as he can't be chosen as a Def now.
Looking at the established players that changed Clubs in 2014, and how they have performed in their 2 seasons at their new Clubs.
Betts - 22/79, 21/86, previous career high 2010 22/85.
Thomas - 20/76, 5/57, previous career high 2011 19/109
Shaw - 18/93, 22/113, previous career high 2012 18/101
Vince - 22/95, 21/98, previous career high 2009 22/98
Dal Santo - 22/103, 12/91 previous career high 2005 22/124
Franklin - 19/100, 17/87 previous career high 2011 19/111
 
Last edited:

Rowsus

Statistician
Joined
19 Mar 2012
Messages
29,137
Likes
64,904
AFL Club
Melbourne
#89
Robbie Gray


Season - 21 games at 110.4 (2014 22 games at 111.0)
Home - 11 games at 117.5 (Home wins 6 at 116.5, Home losses 5 at 118.6)
MCG - 1 games at 63.0 (MCG wins 0 at 0.0, MCG losses 1 at 63.0)
Etihad - 4 games at 90.5 (Etihad wins 3 at 90.7, Etihad losses 1 at 90.0)
Away - 5 games at 120.4 (Away wins 2 at 111.5, Away losses 3 at 126.3)
Wins - 11 games at 108.5
Losses - 10 games at 112.5

Of note...
I think he's found his level, and outside of a spike season, is unlikely to go much higher. 111.0 in 2014, with 551 disposals and 34 goals, then 110.4 in 2015 with 552 disposals and 25 goals. He had a slightly higher CP rate in 2015 to bridge the goal difference. Some will point to his 45% TOG Round 12, where he scored 63 as some sort low point that implies a small discount. He did seem to be on schedule for a 125 in that game, but it only equates to around a 3/game discount in his price (about $16,000). 5 other scores on, or under 90, keep his average under that 115 area (3 of them at Etihad), and he did the same thing in 2014 (with 2 of them at Etihad). He can have down games, or be be kept in check a little too often to become that Super Premium. Fortunately, for those keen on him, Port only play 2 games at Etihad in 2016, Rnds 8 and 17.
 
Last edited:

Rowsus

Statistician
Joined
19 Mar 2012
Messages
29,137
Likes
64,904
AFL Club
Melbourne
#90
Chad Wingard


Season - 22 games at 97.8 (2014 21 games at 79.9)
Home - 12 games at 97.3 (Home wins 7 at 91.9, Home losses 5 at 104.8)
MCG - 1 games at 83.0 (MCG wins 0 at 0.0, MCG losses 1 at 83.0)
Etihad - 4 games at 95.5 (Etihad wins 3 at 101.3, Etihad losses 1 at 78.0)
Away - 5 games at 103.8 (Away wins 2 at 94.5, Away losses 3 at 110.0)
Wins - 12 games at 94.7
Losses - 10 games at 101.5

Of note...
After having 36 goals, and 32 clearances in 2014, Wingard increased those numbers to 53 goals and 54 clearances in 2015. Interestingly enough, most people would assume he gathered most of those clearances when Polec (Rnd 6 on) or Wines (Rnds 4-7, 19 on) went missing, which in theory lead to more on-ball time for Wingard, but not so. Using clearances as an indication of on ball time isn't totally out of order. Wingard averaged 2.45 Clearances/game. He averaged 2.67 when playing his 3 games with both Polec and Wines, 5 when playing with Polec without Wines (2 games), 2.3 when playing with Wines without Polec (10 games), and 1.86 when playing with neither (7 games)! Most of his good scores involved him kicking 3 or 4 goals in a game, a feat he achieved 10 times in 2015, including a 5 goal game that only returned 83! Interestingly enough, these 10 games came in an 11 game period within the season, and actually had a streak of 8 games in it. From Rounds 10 to 18 Wingard kicked 3 or more goals in each of those 8 games, and averaged 107 in that period. In his 62 H & A games prior to 2015, Wingard had only kicked 3+ goals in a game 11 times. I think he possibly ends up a near permanent small forward, if Polec and Wines are ok. Don't forget, when Wingard averaged near 100 in 2013, Polec wasn't there, Gray wasn't at the peak of his powers, and Wines was a first year player. I think Wingard faces an uphill battle to repeat his 2015, in 2016.
 
Last edited:

Rowsus

Statistician
Joined
19 Mar 2012
Messages
29,137
Likes
64,904
AFL Club
Melbourne
#91
Justin Westhoff


Season - 22 games at 94.7 (2014 22 games at 91.1)
Home - 12 games at 98.1 (Home wins 7 at 112.7, Home losses 5 at 77.6)
MCG - 1 games at 101.0 (MCG wins 0 at 0.0, MCG losses 1 at 101.0)
Etihad - 4 games at 76.0 (Etihad wins 3 at 81.0, Etihad losses 1 at 61.0)
Away - 5 games at 100.2 (Away wins 2 at 107.0, Away losses 3 at 95.7)
Wins - 12 games at 103.8
Losses - 10 games at 83.7

Of note...
Like most taller non-Rucks, it is a case of being willing to accept the good with bad, if you take Westhoff. You will celebrate is his 130+ scores (8 in the last 3 seasons, with another 4 120-129 scores), and curse his sub 80 scores (18 in the last 3 seasons, with 4 of those sub 50's!). I think the best approach with Westhoff is to wait for a bad stretch, and a decent price drop, and then if you are inclined, trade him in. Even in 2013, where he started $430,700 and scored 100, 163, 150, 149 in the first 4 Rounds, and his rice jumped up to $572k after Round 5, his price was back down again to $428k after Round 9! He scored: 53, 48, 70, 81, 98 in the next 5 Rounds after that fireball start. But that's how it is with tall players. In 2014 he opened at $531,700, and after Round 10 he had fallen to $372,300 (or about 74/game in points worth), he proceeded to score 1,282 points at an average of 99 in the last 13 games. Pretty good for a $372k buy! Similarly in 2015 he opened at $489,600 and fell to $406,500 (81/game) after Round 8, and then scored 1,463 in the last 14 games at an average of 104.5. Once again, that's gold for a $400k buy. Given his up and down scoring, you'd think he's bound to be cheap at some stage! Keep an eye on his B/E's, and be prepared to take him after a horror stretch. It's against what so many Coaches do, when they want to trade a player in after he has scored 3 x 120+'s.
 
Last edited:

Rowsus

Statistician
Joined
19 Mar 2012
Messages
29,137
Likes
64,904
AFL Club
Melbourne
#92
Brad Ebert


Season - 22 games at 97.0 (2014 22 games at 94.3)
Home - 12 games at 101.8 (Home wins 7 at 100.7, Home losses 5 at 103.4)
MCG - 1 games at 77.0 (MCG wins 0 at 0.0, MCG losses 1 at 77.0)
Etihad - 4 games at 85.3 (Etihad wins 3 at 85.0, Etihad losses 1 at 86.0)
Away - 5 games at 98.6 (Away wins 2 at 104.0, Away losses 3 at 95.0)
Wins - 12 games at 97.3
Losses - 10 games at 96.5

Of note...
Ebert managed to average 112.7 in the first 11 games in 2015! Unfortunately, he only averaged 81.2, and only had one more 100+ score in the 2nd half of the season. He scored 142, 100, 100 in the first 3 games of the season, when Polec and Wines were playing, so it is not their absence that precipitated his good form. The biggest problem is, he has averaged 94 to 100 in each of the last 4 seasons, so it is quite a leap of faith to think he can now post a 110 season. His early good scores were against good opposition (Fre, Syd, Nth), and his other 120+ scores were against Ade, Melb, Wbull, Geel and Fre, so there is a bit of mix of quality in that lot. Given the riches we have on offer this year, it would seem a very brave move to start him in 2016, though he might be a value late pick for Draft League players!
 

Rowsus

Statistician
Joined
19 Mar 2012
Messages
29,137
Likes
64,904
AFL Club
Melbourne
#93
Jasper Pittard


Season - 20 games at 80.4 (2014 22 games at 66.7)
Home - 11 games at 86.3 (Home wins 7 at 88.1, Home losses 4 at 83.0)
MCG - 1 games at 67.0 (MCG wins 0 at 0.0, MCG losses 1 at 67.0)
Etihad - 3 games at 77.0 (Etihad wins 2 at 97.0, Etihad losses 1 at 67.0)
Away - 5 games at 72.4 (Away wins 2 at 73.0, Away losses 3 at 72.0)
Wins - 11 games at 87.0
Losses - 9 games at 72.4

Of note...
Looked the goods in a couple of pre-seaesons now, with some good NAB Cup performances, but it just isn't translating to the regular season. He tricked a few, when he was averaging 99, with 3 tons, after Round 5 in 2015, but then he only managed 2 more tons for the season, in Rounds 20 & 21! In the 11 games he played in between those two periods, he only averaged 68. Of all the stats listed above, only one is of a useable average, his winning average at Etihad. It doesn't leave much to hang your hat on, if you are looking to pick him in 2016.
 
Last edited:

Rowsus

Statistician
Joined
19 Mar 2012
Messages
29,137
Likes
64,904
AFL Club
Melbourne
#94
Oliver Wines


Season - 13 games at 97.3 (2014 22 games at 100.3)
Home - 7 games at 92.6 (Home wins 3 at 96.7, Home losses 4 at 89.5)
MCG - 1 games at 87.0 (MCG wins 0 at 0.0, MCG losses 1 at 87.0)
Etihad - 2 games at 77.0 (Etihad wins 2 at 90.5, Etihad losses 0 at 0.0)
Away - 3 games at 116.3 (Away wins 1 at 123.0, Away losses 2 at 113.0)
Wins - 6 games at 99.0
Losses - 7 games at 95.9

Of note...
Wines has 2 injury affected scores in his analysis, when we take those out, it looks like this:
Season - 11 games at 106.2 (2014 22 games at 100.3)
Home - 6 games at 104.5 (Home wins 2 at 134.5, Home losses 4 at 89.5)
MCG - 1 games at 87.0 (MCG wins 0 at 0.0, MCG losses 1 at 87.0)
Etihad - 1 games at 105.0 (Etihad wins 1 at 105.0, Etihad losses 0 at 0.0)
Away - 3 games at 116.3 (Away wins 1 at 123.0, Away losses 2 at 113.0)
Wins - 4 games at 124.3
Losses - 7 games at 95.9
Wines' adjusted average in winning games of 124.3 is pretty impressive for those that are keen on him, especially given Port's early Draw: Stk, Ade, Ess, GWS, Geel, Rich, Bris, Carl. bold =AO
It is possible for them to win all 8, and they should win at least 5 of them. On last years break up figures for scores in wins/losses Wines potentially averages around 112 to Round 8. Not bad for a player priced under 100.
 
Last edited:

Rowsus

Statistician
Joined
19 Mar 2012
Messages
29,137
Likes
64,904
AFL Club
Melbourne
#95
Matthew Broadbent


Season - 21 games at 83.3 (2014 22 games at 82.0)
Home - 11 games at 82.1 (Home wins 7 at 86.6, Home losses 4 at 74.3)
MCG - 1 games at 85.0 (MCG wins 0 at 0.0, MCG losses 1 at 85.0)
Etihad - 4 games at 91.8 (Etihad wins 3 at 92.7, Etihad losses 1 at 89.0)
Away - 5 games at 79.0 (Away wins 2 at 91.5, Away losses 3 at 71.7)
Wins - 12 games at 88.9
Losses - 9 games at 75.9

Of note...
Just too inconsistent, and now that he has played 125 games, he's unlikely to suddenly change his scoring pattern, without a significant role change.
2012 averaged 84.5, with 4 x 100+ scores, and 7 x sub 70's
2013 averaged 79.5, with 7 x 100+ scores, and 10 x sub 70's
2014 averaged 82.0, with 7 x 100+ scores, and 7 x sub 70's
2015 averaged 83.3, with 4 x 100+ scores and 5 a sub 70's
It's hard to get far enough into the 90's, unless you cut out at least half of those sub 70's, or even more.
 
Last edited:

Rowsus

Statistician
Joined
19 Mar 2012
Messages
29,137
Likes
64,904
AFL Club
Melbourne
#96
Trent Cotchin


Season - 21 games at 99.8 (2014 22 games at 101.7)
MCG - 13 games at 102.5 (MCG wins 8 at 105.8, MCG losses 5 at 97.4)
Etihad - 2 games at 94.0 (Etihad wins 2 at 94.0, Etihad losses 0 at 0.0)
Interstate - 6 games at 95.8 (Interstate wins 4 at 105.3, Interstate losses 2 at 77.0)
Wins - 14 games at 103.9
Losses - 7 games at 91.6

Of note...
Between Rounds 2 & 15 Cotchin averaged 110.5, proof that he can still score at the required level over a period of time. The obvious problem is, you need him to do it over a longer period than that. Between Rounds 16 & 21 he averaged only 80.7, with a top score of 97. He averaged only 83 from his 5 games on small grounds, and 4 of those were wins.
There is some precedence for a player to be 110+, and have more than 1 year below 110+, and then return to the high zone again:
Barlow 116 in 2010, then 84, 95 before going 110, 112 in 2013, 2014 (broken leg recovery caused low seasons).
Deledio 117 in 2012, then 104, 103 before going 113 in 2015.
Goodes 120 in 2006, then 105, 106 before going 114 in 2009.
Hayes 120 in 2006, then 103, 102 before going 119 in 2009.
Mitchell S 110 in 2005, then 106, 101, 101, 109, 99 before going 111 in 2012.
Montagna 115 in 2010, then 101, 99 before going 115 in 2013.
Mumford 113 in 2011, then 91, 92 before going 114 in 2014.
Pavlich 111 in 2008, then 100, 99, 96 before going 111 in 2012.
Rockliff 114 in 2011, then 97, 109.7 before going 132 in 2014.
....... and the biggest gap of all .......
Tuck 112 in 2005, then 92, 83, 100, 98, 103, 82 before going 115 in 2012.
So the precedence is there, for Cotchin to go 110+ again.
 
Last edited:

Rowsus

Statistician
Joined
19 Mar 2012
Messages
29,137
Likes
64,904
AFL Club
Melbourne
#97
Ivan Maric


Season - 21 games at 95.4 (2014 13 games at 99.7)
MCG - 13 games at 96.3 (MCG wins 8 at 105.3, MCG losses 5 at 82.0)
Etihad - 2 games at 90.5 (Etihad wins 2 at 90.5, Etihad losses 0 at 0.0)
Interstate - 6 games at 95.2 (Interstate wins 4 at 98.0, Interstate losses 2 at 89.5)
Wins - 14 games at 101.1
Losses - 7 games at 94.1

Of note...
6 of Maric's 7 110+ scores were on larger grounds. In chronological order:
Rnd 4 124 vs Melb (Jamar) at MCG 32 point loss.
Rnd 6 126 vs North (Goldy) at Blund 35 point loss.
Rnd 7 139 vs Coll (Grundy/Witts) at MCG 5 point win.
Rnd 8 125 vs Port (Lobbe/Ryder) at AO 33 point win.
Rnd 9 112 vs Ess (Bellchambers) at MCG 13 point win.
Rnd 18 117 vs Haw (McEvoy/Hale) at MCG 18 point win.
Rnd 22 115 vs Ess (McKernan) at MCG 27 point win.
Only two of those were against opposition tricky for Rucks to score well against. In the 6 games between Rnds 4 and 9 Maric averaged 116.8 and 86.9 in his other 15 games for the season. This fits his pattern in the last 3 seasons. Maric is being managed with chronic injuries, and when he is fit he scores as well as nearly any Ruck. When he is playing sore, he can drop around 30/game.
 
Last edited:

Rowsus

Statistician
Joined
19 Mar 2012
Messages
29,137
Likes
64,904
AFL Club
Melbourne
#98
Brett Delidio


Season - 17 games at 112.8 (2014 18 games at 102.9)
MCG - 11 games at 112.7 (MCG wins 9 at 113.2, MCG losses 2 at 110.5)
Etihad - 2 games at 137.0 (Etihad wins 2 at 137.0, Etihad losses 0 at 0.0)
Interstate - 4 games at 101.3 (Interstate wins 3 at 115.0, Interstate losses 1 at 60.0)
Wins - 14 games at 117.0
Losses - 3 games at 93.7

Of note...
7 scores above 130, which he also managed in 2012 with his career high 116.6 season. Even with the 4 missed games he PIT65'ed 101.9, which is good enough for a Forward. The two problems are: Outside of 2012 and 2015, he has looked like a 102-106 player, and he has only managed 17 and 18 games in the last 2 seasons. If he averages 104 with 18 games this season, that's a PIT65 of 96.9, that's still ok, but not what you are looking for from a Forward you paid $600k+ plus for. In fact, Deledio has only been more expensive in 7 Rounds in his entire career. When you are talking about a player who as well as getting older, is also starting to miss games, that seems to be too high of a risk for starting teams for my money.
 
Last edited:

Rowsus

Statistician
Joined
19 Mar 2012
Messages
29,137
Likes
64,904
AFL Club
Melbourne
#99
Dustin Martin


Season - 22 games at 105.5 (2014 21 games at 99.5)
MCG - 14 games at 99.7 (MCG wins 9 at 91.0, MCG losses 5 at 115.4)
Etihad - 2 games at 107.0 (Etihad wins 2 at 107.0, Etihad losses 0 at 0.0)
Interstate - 6 games at 118.7 (Interstate wins 4 at 109.3, Interstate losses 2 at 137.5)
Wins - 15 games at 98.0
Losses - 7 games at 121.7

Of note...
Unusual reverse FTB trend in his scoring. Nearly 24 higher in losing games is quite a difference! 4 scores of 68 and lower are what stopped him being a 110+ player last season. He's probably never likely to have a season without a few of those thrown in there, it's just the nature of the beast. He's never played less than 20 games in a season, so he is pretty reliable to get on the park for you.
The other interesting thing, is Martin's record interstate.
2010 - in Vic 16/76.7, Interstate 5/81.8
2011 - in Vic 16/95.4, Interstate 6/108.3
2012 - in Vic 15/87.1, Interstate 5/92.8
2013 - in Vic 16/96.4, Interstate 6/116.2
2014 - in Vic 15/101.6, Interstate 6/94.3
2015 - in Vic 16/100.6, Interstate 6/118.7
Career - in Vic 94/92.9, Interstate 34/102.9
Richmond play Interstate in Rounds: 4, 9, 11, 15, 19, 23 in 2016.
 
Last edited:

Rowsus

Statistician
Joined
19 Mar 2012
Messages
29,137
Likes
64,904
AFL Club
Melbourne
Shane Edwards


Season - 15 games at 91.3 (2014 22 games at 84.8)
MCG - 9 games at 90.7 (MCG wins 6 at 91.8, MCG losses 3 at 88.3)
Etihad - 1 games at 72.0 (Etihad wins 1 at 72.0, Etihad losses 0 at 0.0)
Interstate - 5 games at 96.4 (Interstate wins 4 at 87.0, Interstate losses 1 at 134.0)
Wins - 11 games at 88.3
Losses - 4 games at 99.8

Of note...
There's a very simple key to Shane Edwards (in 2015, anyway!). If and how Brett Deledio is playing is that key.
Games played without Deledio: 3 games at 102.7
Games played where Deledio is either restricted by injury or opposition: 4 games at 116.3
Games played with Deledio fit, and not restricted by opposition: 8 games at 74.6
If Deledio goes down, Edwards is worth a shot. Those playing a draft comp that get Deledio might do well to grab Edwards with a late pick, as a nice coupling. Outside of that, I'd leave Edwards alone.
 
Last edited:
Top